

Este indicador permite tener una visión de como se comportara el mercado en el futuro si se mantienen las condiciones actuales de mercado, realizando una extrapolación a futuro del pasado reciente del activo analizado.
This indicator allows a view of how the market will behave in the future if current market conditions continue, making future extrapolate the recent past of the analyzed asset.
Этот показатель позволяет представление о том, что рынок будет вести себя в будущем, если текущие рыночные условия продолжают, делая будущее экстраполировать недавнее прошлое анализируемого актива.
Este indicador seria considerado una ayuda visual, ya que lo que nos permite es tener una idea de como debe proseguir el mercado y ayudarnos a tomar las decisiones operativas adecuadas, conociendo que pasaría si el mercado continuara en la misma dinámica. Sabiendo si nuestra decisión operativa va a favor del mercado o en contra del mercado.
This indicator would be considered a visual aid, since allowing us is to have an idea of how the market should continue and help to take appropriate operational decisions, knowing that if the market would continue in the same dynamic. Knowing whether our operational decision goes in favor of the market or against the market.
Этот показатель будет считаться наглядным пособием, так как позволяет нам, чтобы иметь представление о том, что рынок следует продолжать и помочь принять соответствующие оперативные решения, зная, что если рынок будет продолжать в том же динамике. Зная идет ли наша операционная решение в пользу рынка или против рынка.
En el siguiente video puedes ver información del indicador:
In the following video you can see information indicator:
В следующем видео вы можете увидеть индикатор информации:
En las siguientes imágenes del indicador, se observan las tres líneas que lo componen y que se dibujan mas allá del precio simulando una línea imaginaria que proyectaría el precio en los 30 periodos siguientes al momento actual:
The following pictures of the indicator, the three lines that compose it are observed and they are drawn beyond the price simulating an imaginary line that would project the price within 30 periods a moment?
Следующие фотографии индикатора, три линии, которые составляют его наблюдаются, и они тянутся за ценой, имитирующей воображаемую линию, что бы проецировать на цену в 30 периодов мгновение?
A continuación vamos a explicar el significado de las tres líneas que dibuja el indicador en el grafico.
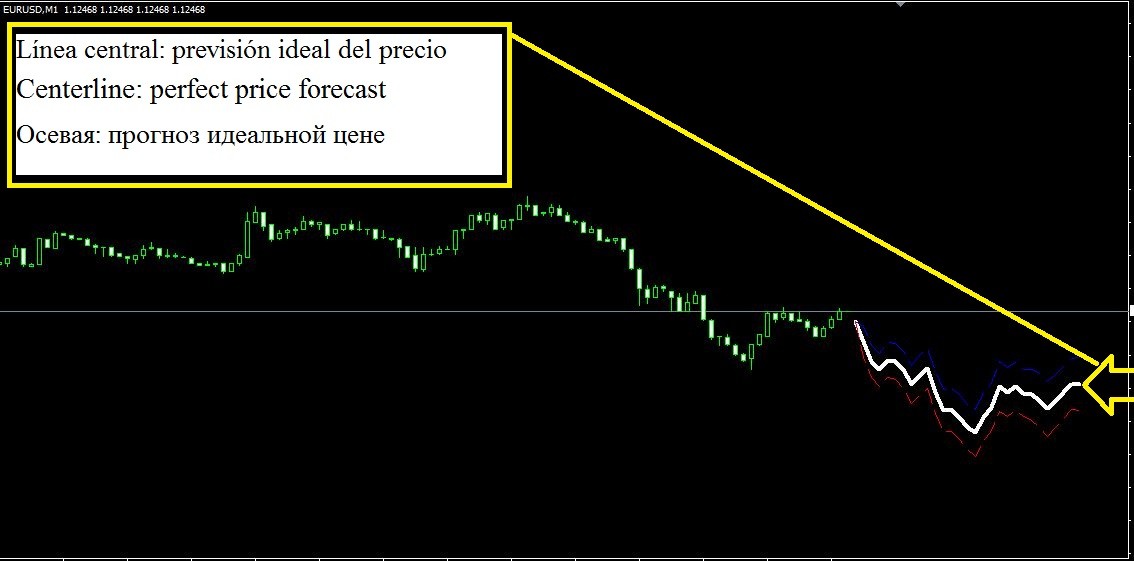
La línea central marca la situación del precio en un futuro próximo si se mantuvieran las condiciones previas de mercado, es decir la extrapolación exacta del precio a futuro. Esta línea mostraría la situación del precio en las siguientes 30 velas si el precio siguiera la dinámica actual. Ya que el precio lógicamente va a tener cierta variabilidad, se necesita dar un rango que nos defina una zona de probabilidad dentro de la cual se encontraría el precio, el ancho de esta zona dependerá del pasado, por lo tanto cuanto mas amplia sea esta zona menos fiable será la predicción, al contrario cuanto mas estrecha sea esta zona más fiable será la predicción.
Below we will explain the meaning of the three lines drawn on the chart indicator.
The center line marks the price situation in the near future if market conditions precedent were maintained, ie the exact extrapolation to future price. This line would show the price situation in the next 30 candles if the price continue the current momentum. Since the price obviously going to have some variability, we need to give a range that defines us a probability zone within which the price would be found, the width of this area depend on the past, so the more wide for it this area less reliable the prediction, contrary to the closer it is this area will be more reliable prediction.
Ниже мы объясним значение из трех линий, нарисованных на графике индикатора.
Центральная линия отмечает ценовой ситуации в ближайшем будущем, если рыночные условия, предшествующие были сохранены, то есть точной экстраполяции на будущей цене. Эта линия будет показывать ценовой ситуации в ближайшие 30 свечей, если цена продолжит текущую динамику. Так как цена, очевидно, будет иметь некоторую изменчивость, мы должны дать диапазон, который определяет нам зону вероятности, в течение которого цена будет найдена, ширина этой области зависит от прошлого, так что чем больше в ширину для него эта область менее надежны предсказание, вопреки ближе именно эта область будет более надежным предсказание.
La línea superior marca la desviación calculada de la línea por encima del precio ideal, nos marca un rango de probabilidad alto de mantenimiento del precio dentro del rango superior, si el precio sigue manteniendo las condiciones previas de mercado. La distancia entre esta línea y la línea ideal varia a lo largo del tiempo.
The top line shows the calculated deviation of the line above the ideal price, we mark a range of high probability of price maintenance in the upper range, if the price continues to maintain market preconditions. The distance between this line and the ideal line varies over time.
On, the closer is this contrast more reliable the prediction area.
В верхней строке отображается расчетное отклонение выше идеальной цене линии, мы отмечаем ряд высокой вероятностью обслуживания цен в верхнем диапазоне, если цена продолжает поддерживать рыночные предпосылки. Расстояние между этой линии и идеальной линии изменяется с течением времени.
На чем ближе этот контраст более надежным область предсказания.

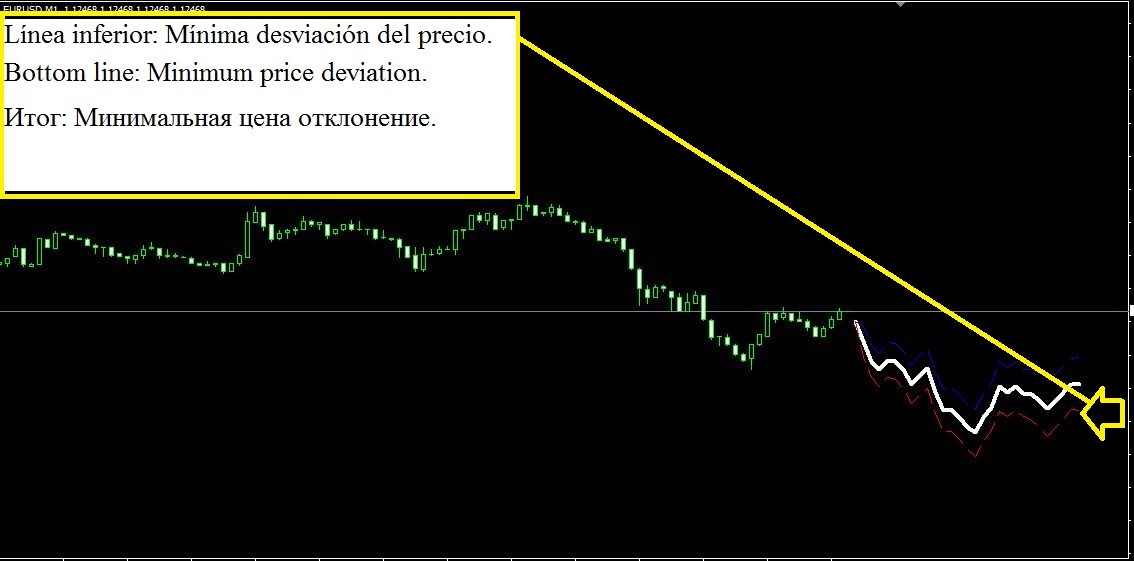
La línea inferior marca la desviación calculada de la línea por debajo del precio ideal, nos marca un rango de probabilidad alto de mantenimiento del precio dentro del rango inferior, si el precio sigue manteniendo las condiciones previas de mercado. La distancia entre esta línea y la central no se mantiene constante y depende de las condiciones del mercado.
The bottom line shows the calculated deviation of the line below the ideal price, we mark a range of high probability of price support within the lower range, if the price continues to maintain market preconditions. The distance between this line and the center is not constant and depends on market conditions.
В нижней строке отображается расчетное отклонение линии ниже идеального цене, мы отмечаем ряд высокой вероятностью ценовой поддержки в нижнем диапазоне, если цена продолжает поддерживать рыночные предпосылки. Расстояние между этой линией и центром не является постоянной и зависит от рыночных условий.
Vamos a repasar a continuación diferentes situaciones de mercado que podemos observar con este indicador:
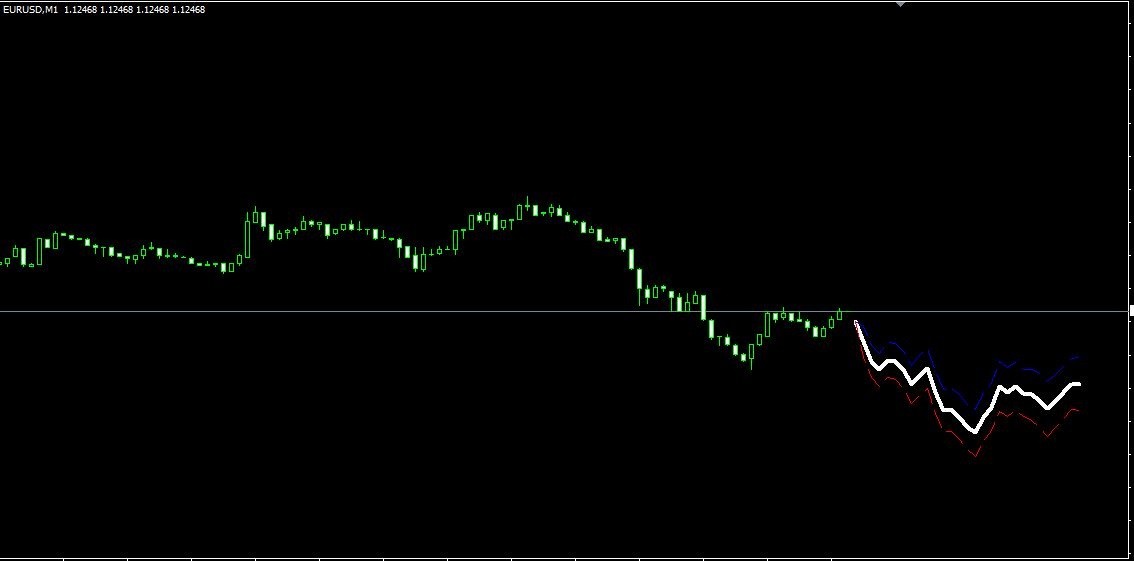
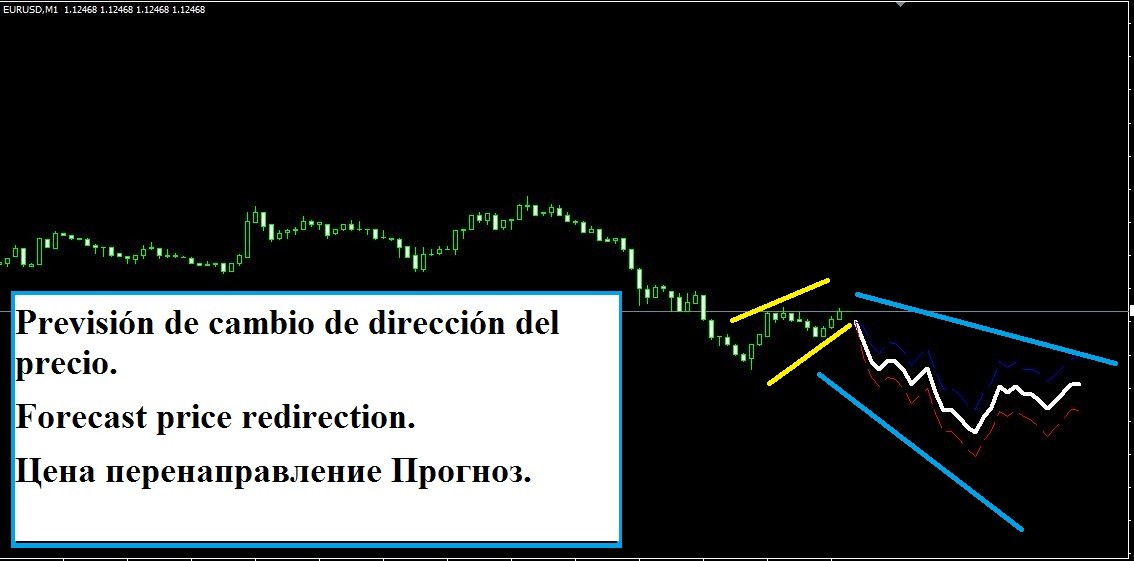
En el siguiente grafico observamos como nos marca un cambio de tendencia en una subtendencia ascendente nos marca una corrección para volver a la tendencia superior que en este caso es bajista.
We will then review different market situations that we see with this indicator:
In the following graph we see as we mark a turnaround in an upward correction mark subtendencia us to return to the upper trend here is bearish.
После этого мы рассмотрим различные рыночные ситуации, которые мы видим с этим показателем:
В следующем графике мы видим, как мы отмечаем поворот в восходящем коррекции отметки subtendencia нам вернуться к верхней тенденции здесь является медвежьим.
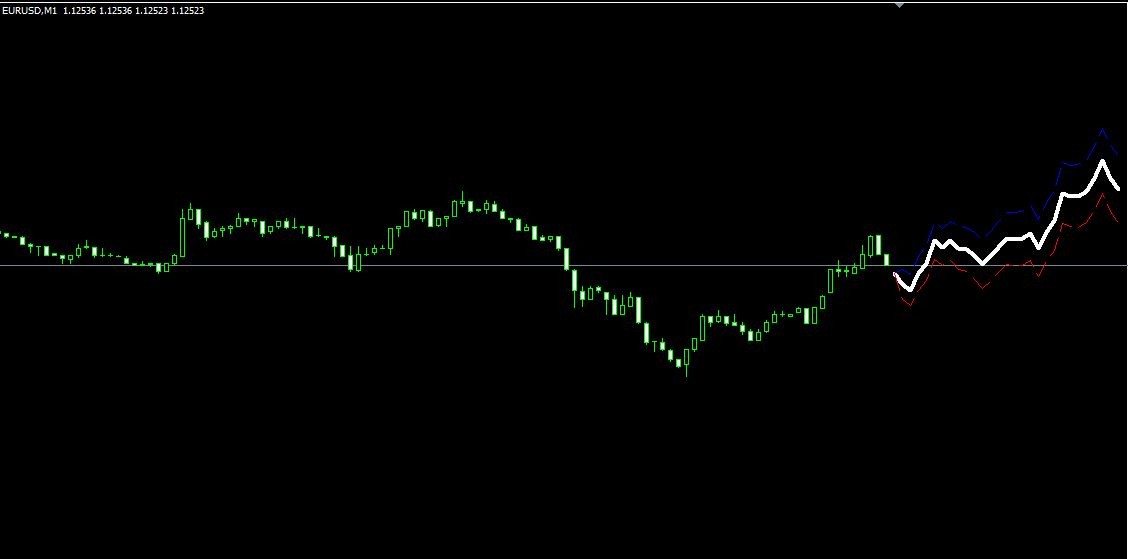
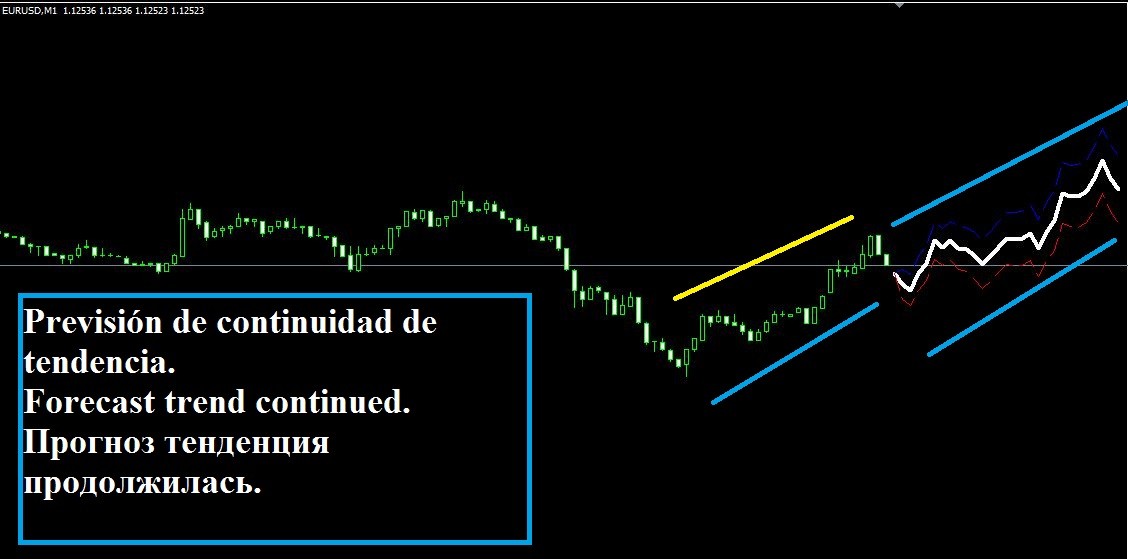
En el siguiente ejemplo observamos como el indicador nos marca una continuidad en la tendencia de fondo que marca el mercado.
In the following example we see how the indicator marks a continuity in the underlying trend set by the market.
В следующем примере мы видим, как индикатор отмечает преемственность в основной тенденции, установленной на рынке.
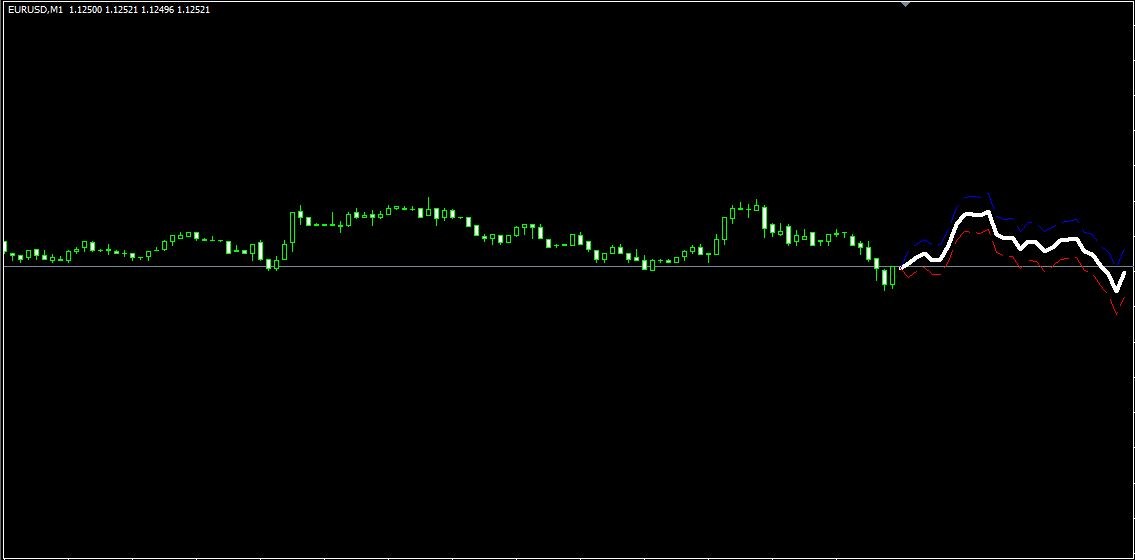
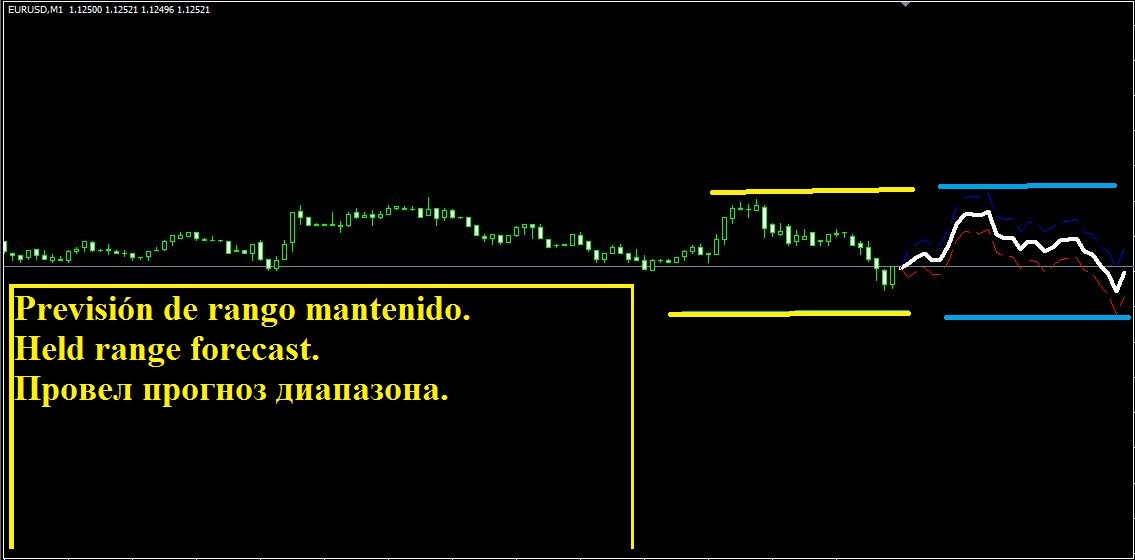
En el siguiente ejemplo nos marca como el mercado se mantiene en un rango.
In the following example we mark as the market remains in a range.
В следующем примере мы отмечаем как рынок остается в диапазоне.
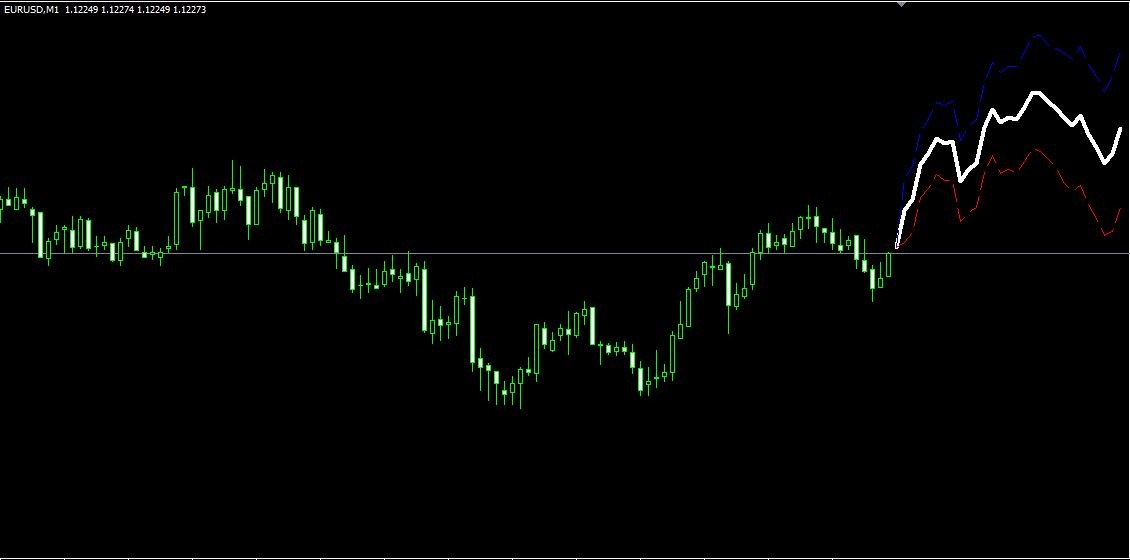
Por ultimo observamos como el indicador nos marca el fin de la corrección y la continuidad del mercado alcista previo.
Finally we see how the indicator marks the end of the correction and the continuity of the previous bull market.
Наконец, мы видим, как индикатор знаменует окончание коррекции и непрерывность предыдущего бычьего рынка.

El indicador no tiene parámetros externos configurables, ya que analiza el mercado y el decide en función de los parámetros que analiza que algoritmo aplicar para su configuración.
Las tres líneas si son configurables en cuanto a grosos y color a gusto del usuario y para que sean mas visibles si el usuario decide cambias los colores del grafico.
Si tienes alguna duda o comentario sobre este indicador no dudes en ponerte en contacto conmigo.
The indicator has not configurable external parameters, and analyzing the market and decided according to the parameters analyzed that apply to your configuration algorithm.
If the three lines are configurable in terms grosos and color to suit the user and to be more visible if the user decides to change the colors of the chart.
If you have any questions or comments about this indicator do not hesitate to contact me.
Индикатор имеет не настраиваемые внешние параметры, и анализа рынка, и решил в соответствии с параметрами анализируемых, которые относятся к вашей алгоритма конфигурации.
Если три линии настраиваются в плане grosos и цвета, чтобы удовлетворить пользователя и быть более заметными, если пользователь решит изменить цвета на графике.
Если у вас есть какие-либо вопросы или комментарии по поводу данного показателя, не стесняйтесь обращаться ко мне.
Un saludo


