Igor Zizek / Profile
- Information
|
4 years
experience
|
14
products
|
322
demo versions
|
|
0
jobs
|
0
signals
|
0
subscribers
|
YouTube: https://youtube.com/Tradingbox
Facebook: https://www.facebook.com/TradingBoxTools
E-mail: mt4tradingboxea@gmail.com
All my links at one place: https://znap.link/tradingbox
Order management: https://www.mt4tradingbox.com/order-management/
Technical analysis tool mt4 mt5: https://www.mt4tradingbox.com/technical-analysis/
Rectangle indicator: https://www.mt4tradingbox.com/rectangle-extender/
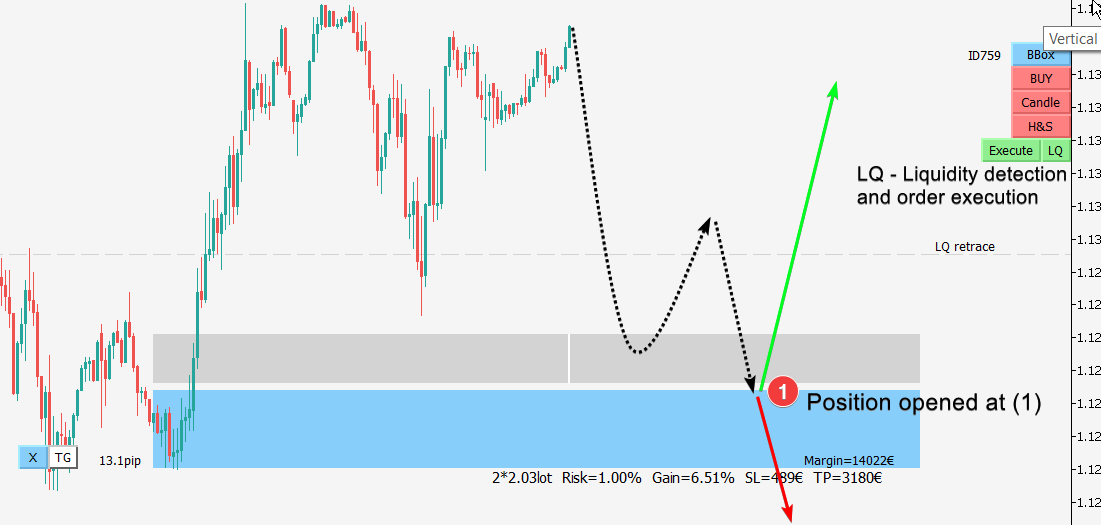
When we want to trade a certain price level (zone), we need to have liquidity trading in the market to have good order price execution. If price is going straight to our level, then this is not good price approach toward our level where we want to trade. We developed liquidity detection function, to search for forex liquidity instead of trader himself (LQ button). You need to predict where liquidity will be created and move silver rectangle to this price level zone. You also need to define how much big retrace from silver rectangle you want. This is defined with LQ rectangle horizontal line. You can move this horizontal line. When price will come to silver rectangle and go back to LQ retrace line, then you will receive alert. Detected extreme will be marked with light green trendline. Execute button that will activate Order box when market liquidity is detected.
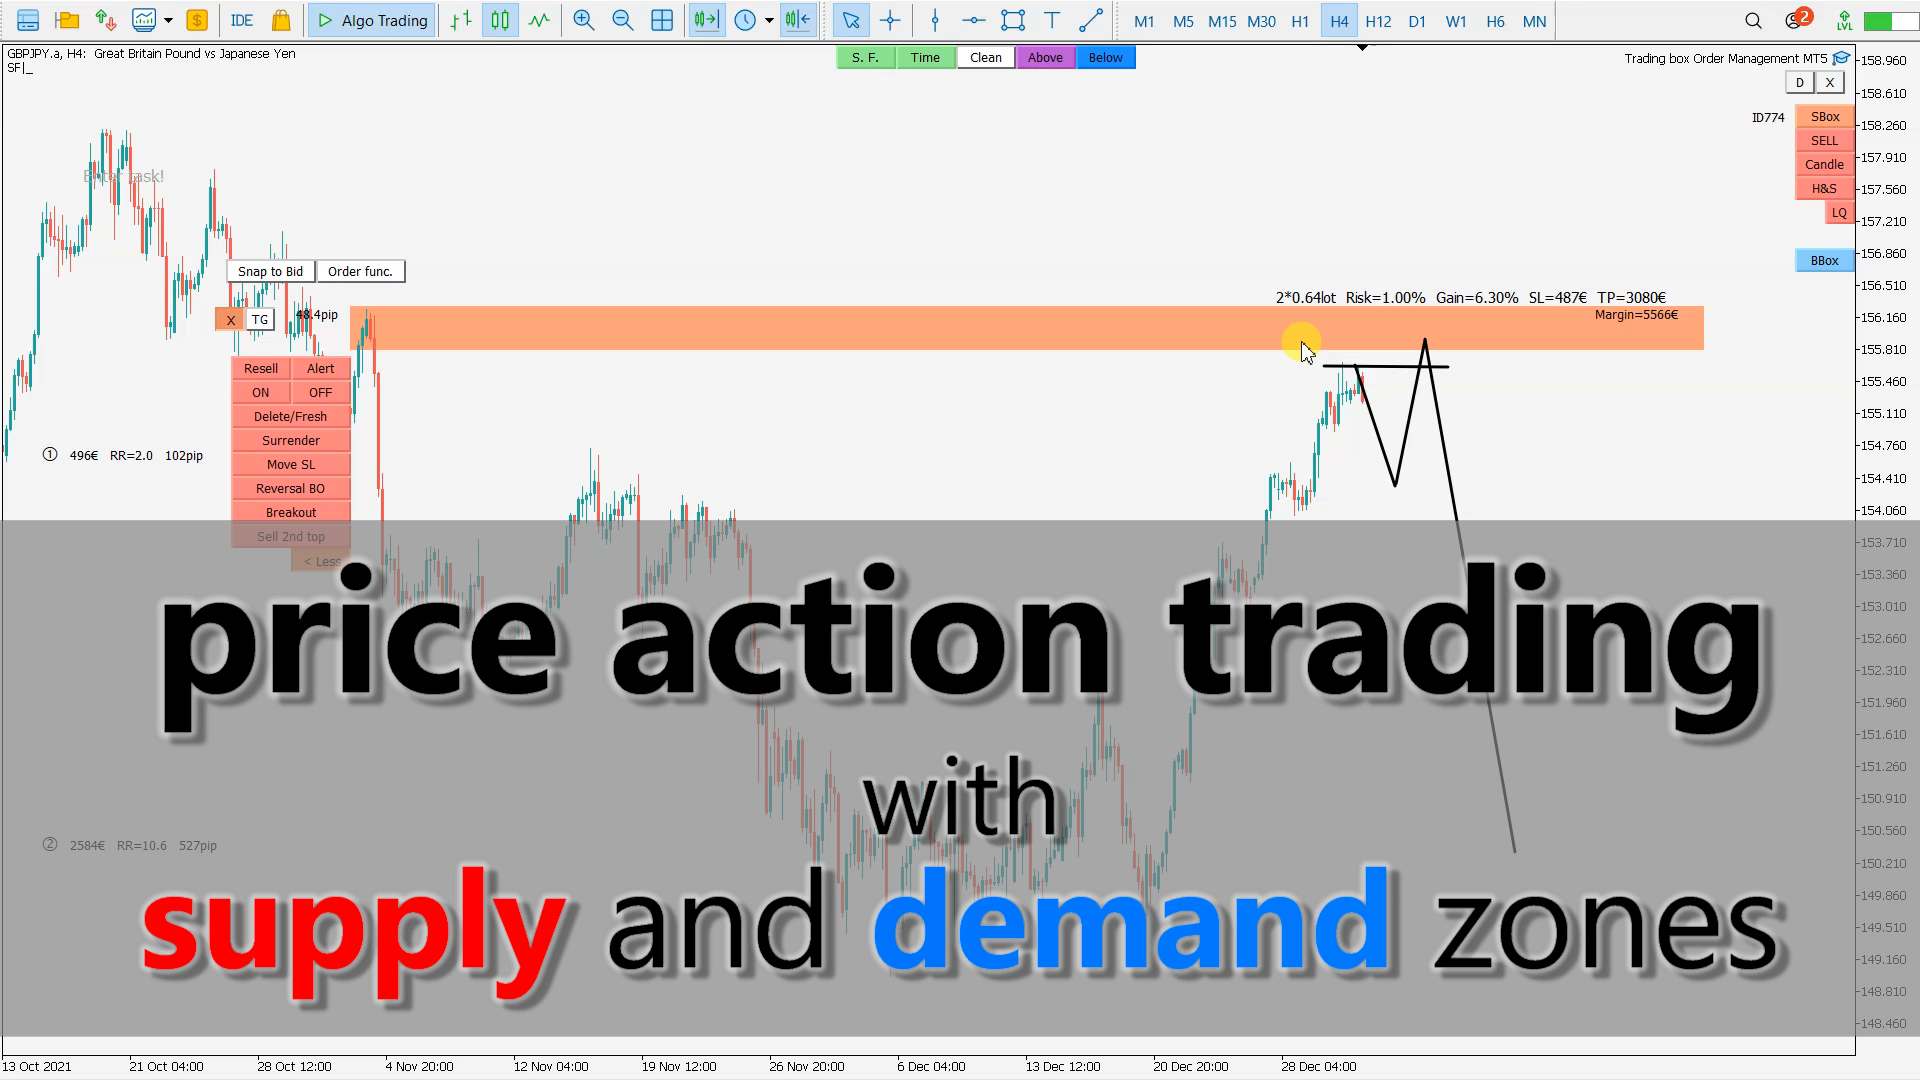
Price action trading with supply and demand zones
link: https://www.youtube.com/watch?v=OGNLyH8UAeE
Rectangle position changer tool is used for precise/accurate rectangle positioning by time or price only. You can move each side of rectangle separately with lines created around selected rectangle. This tool will replace classical grid because it is like dynamical chart grid for rectangle grid. This tool allows you to adjust your rectangles, from all 4 sides, with ease and makes your technical analysis that much faster. This tool is handy when corner points for changing rectangle
Rectangle position changer tool ( rectangle indicator) is used for precise/accurate rectangle positioning by time or price only. You can move each side of rectangle separately with lines created around selected rectangle. This tool will replace classical grid because it is like dynamical chart grid for rectangle grid. This tool allows you to adjust your rectangles, from all 4 sides, with ease and makes your technical analysis that much faster. This tool is handy when corner points
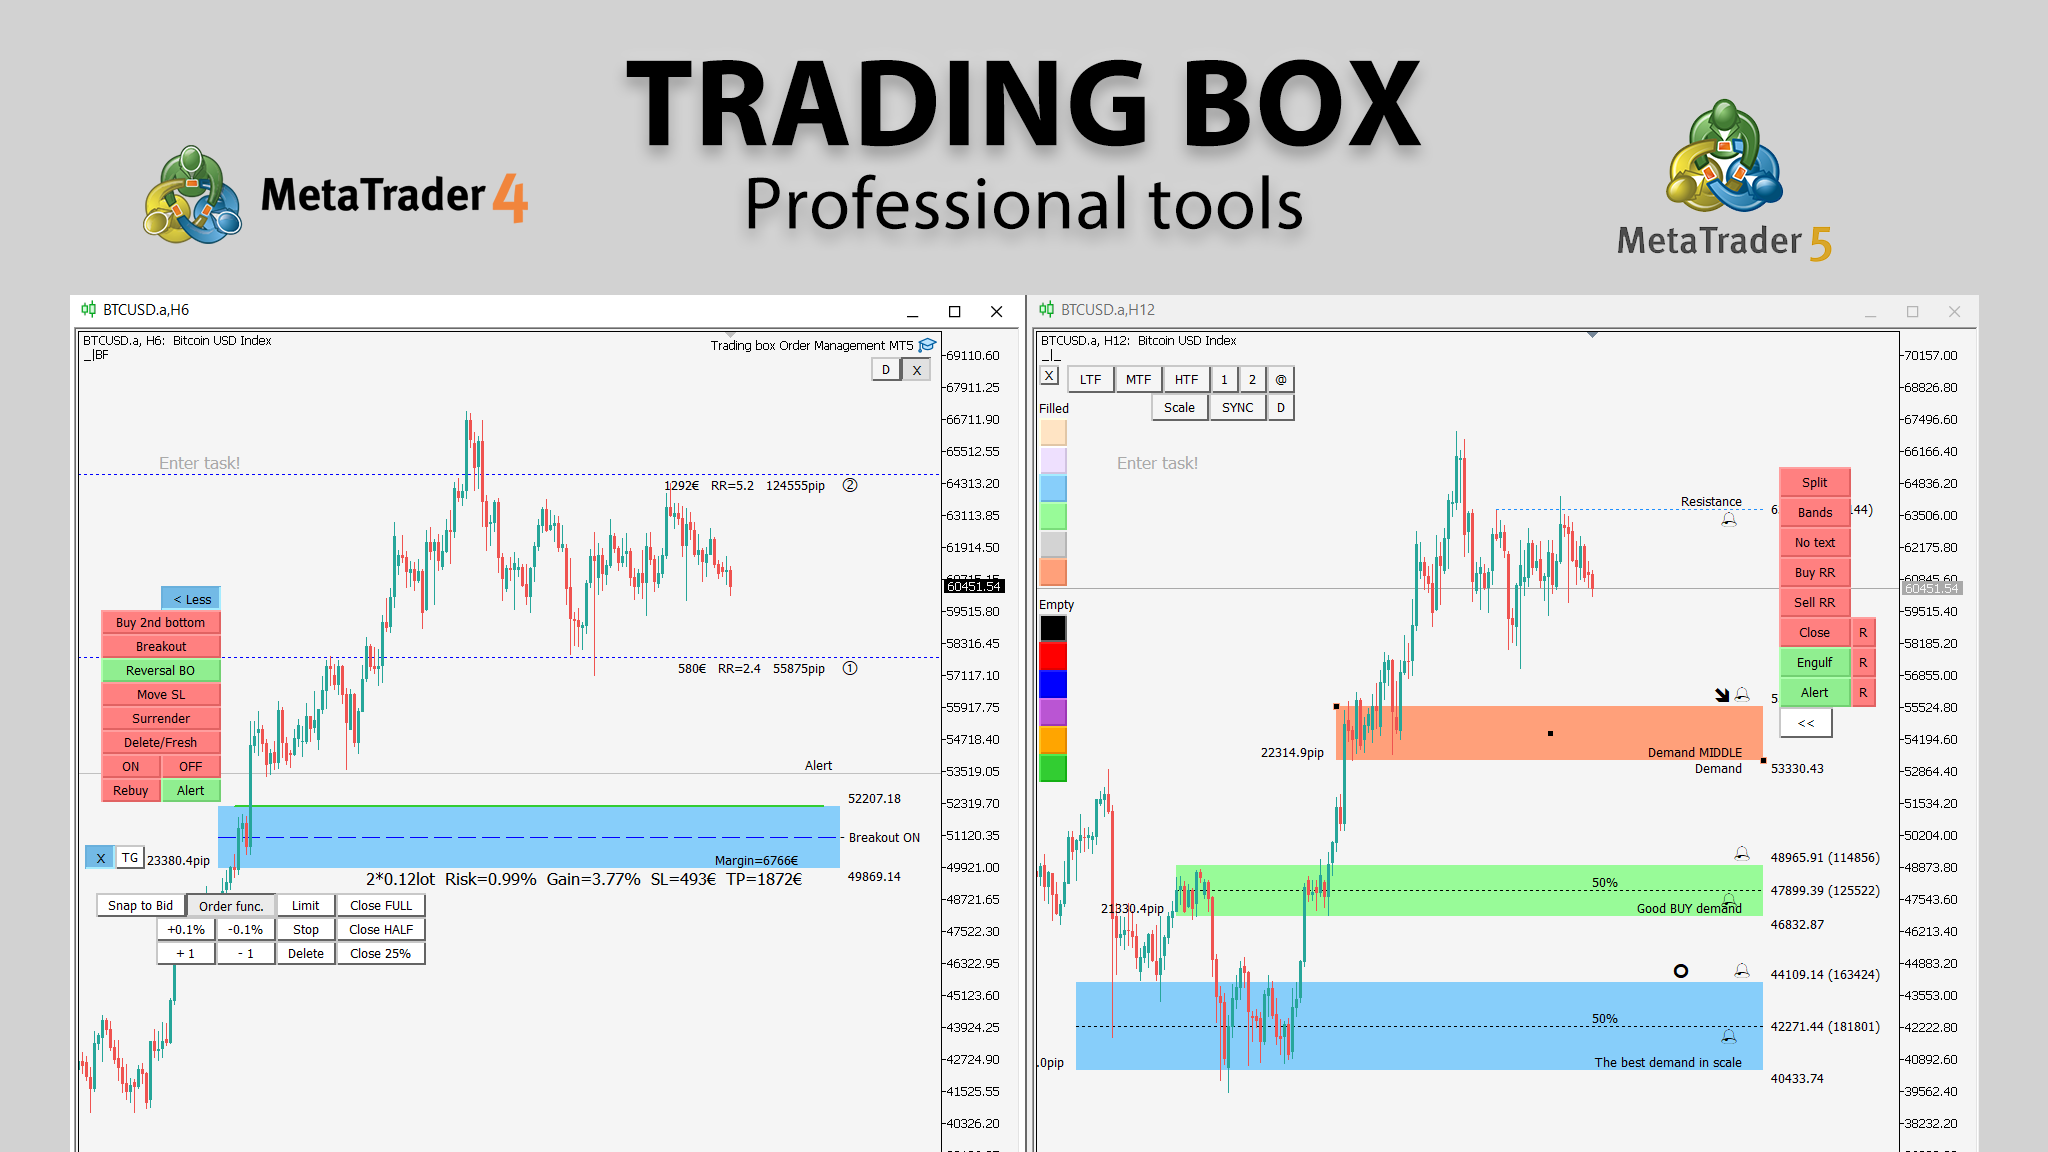
If you are using MetaTrader for trading or technical analysis then you can try using Trading box tools for CHFJPY and AUDCAD.
Trading box Order Management
MT4: https://www.mql5.com/en/market/product/47888
MT5: https://www.mql5.com/en/market/product/69631
Trading box Technical analysis
MT4: https://www.mql5.com/en/market/product/68338
MT5: https://www.mql5.com/en/market/product/68339
https://www.youtube.com/watch?v=XRFk6IMa0fw
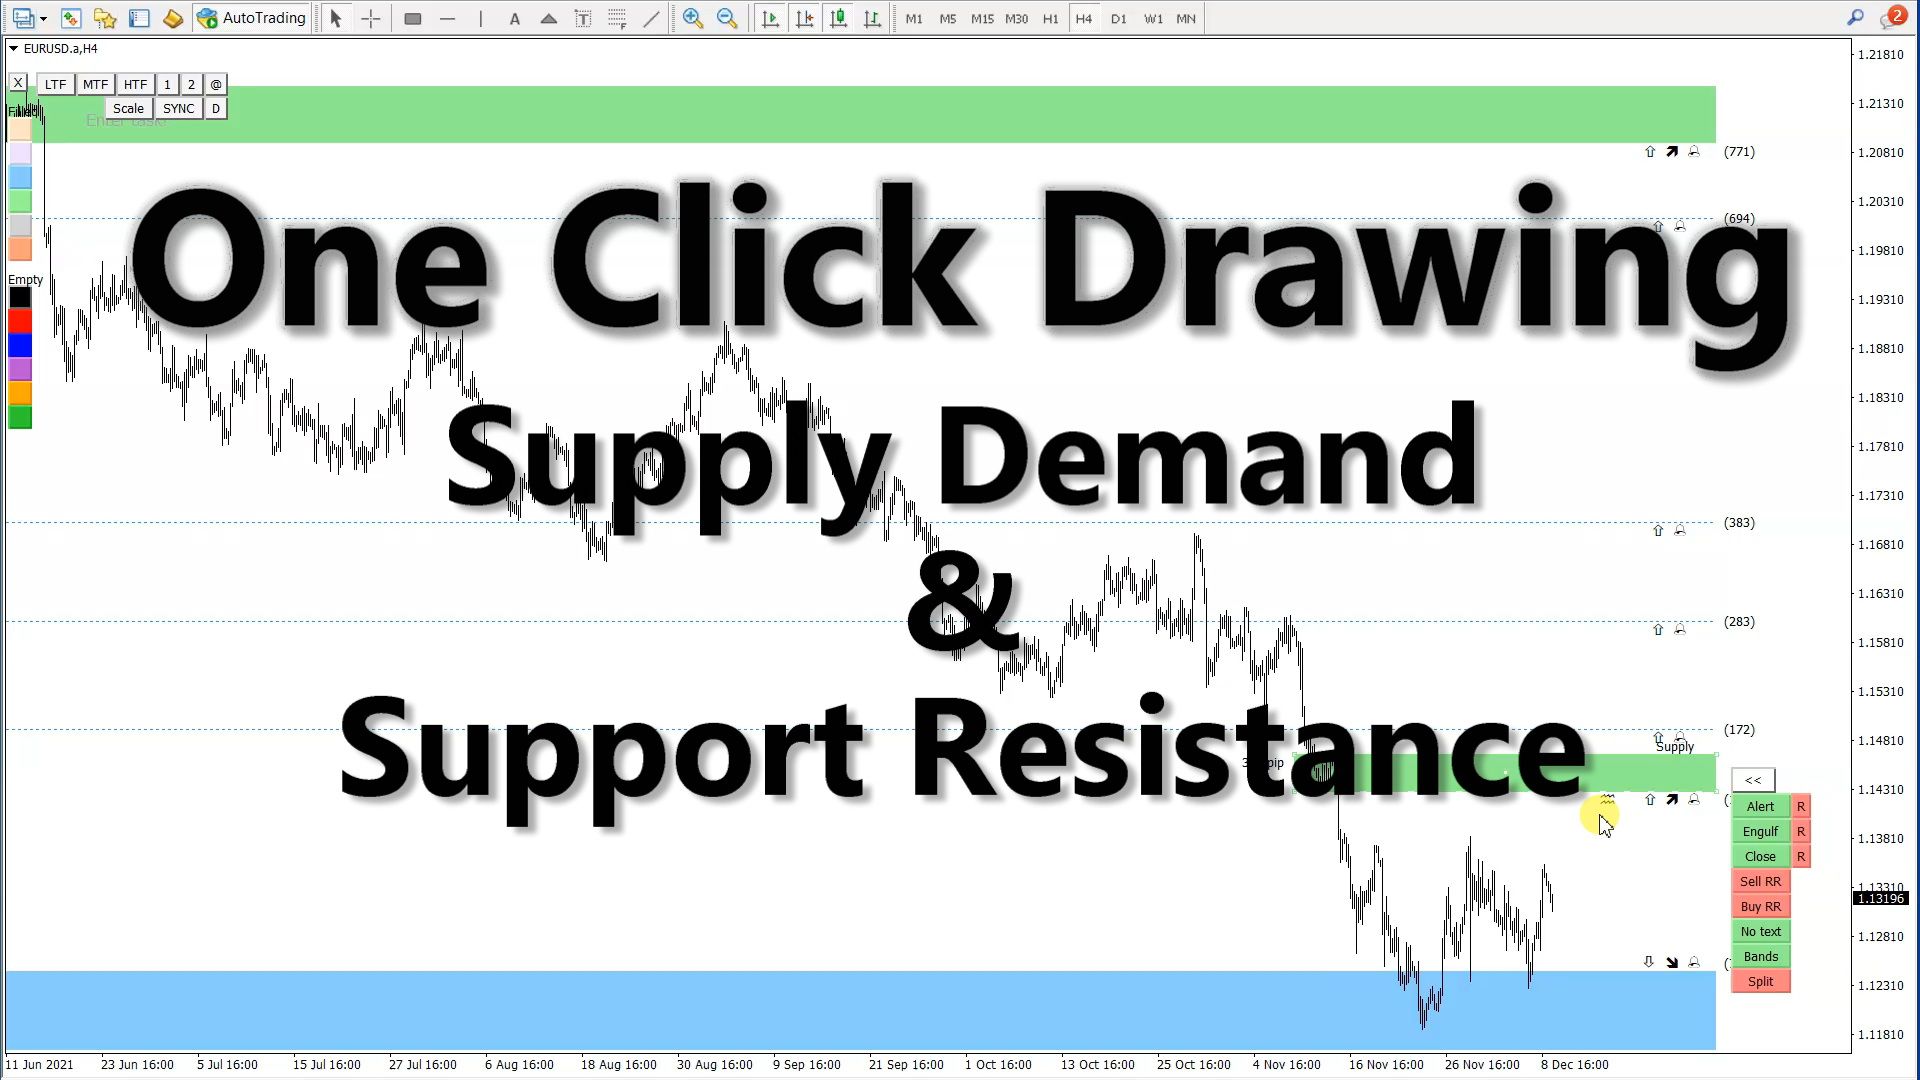
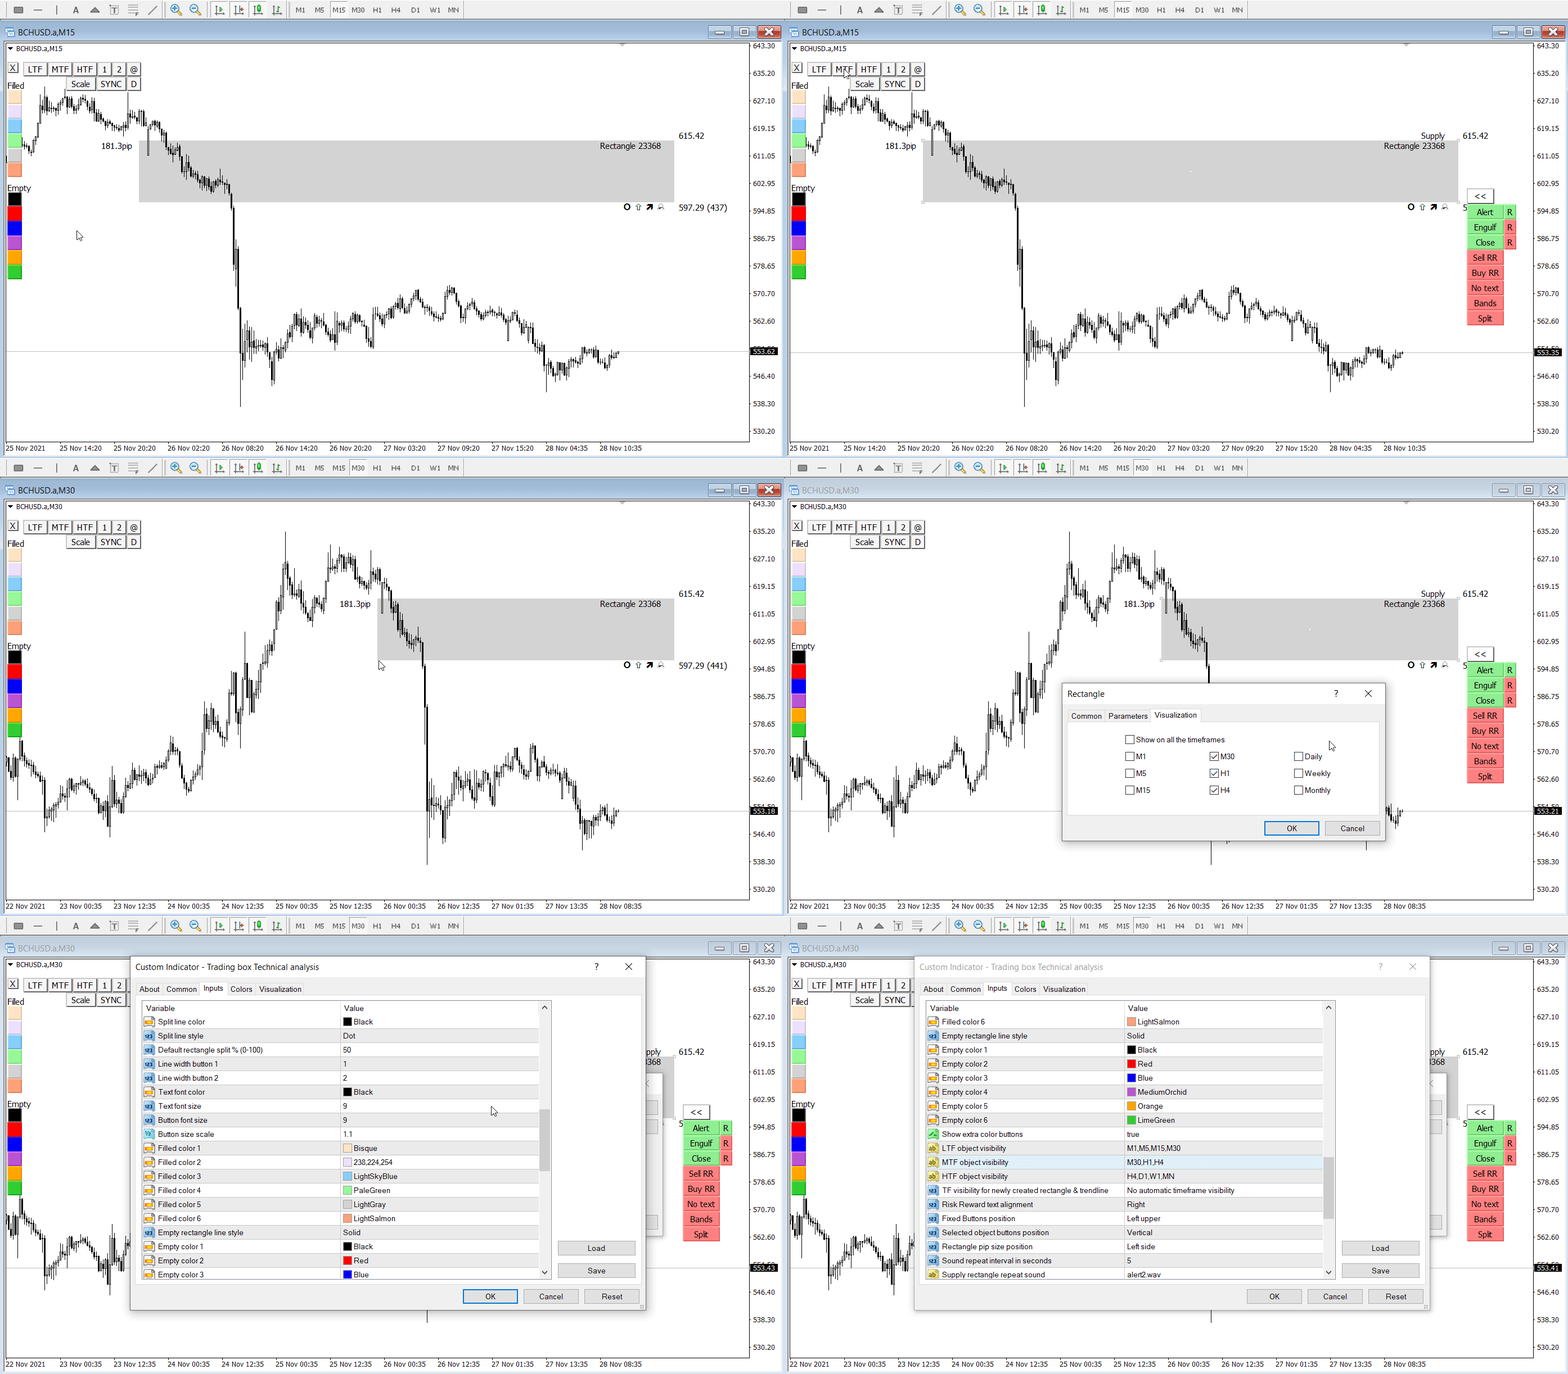
Quickly change color for selected object with color button click. If no object is selected then color buttons will create a new rectangle, otherwise the selected object color will be changed
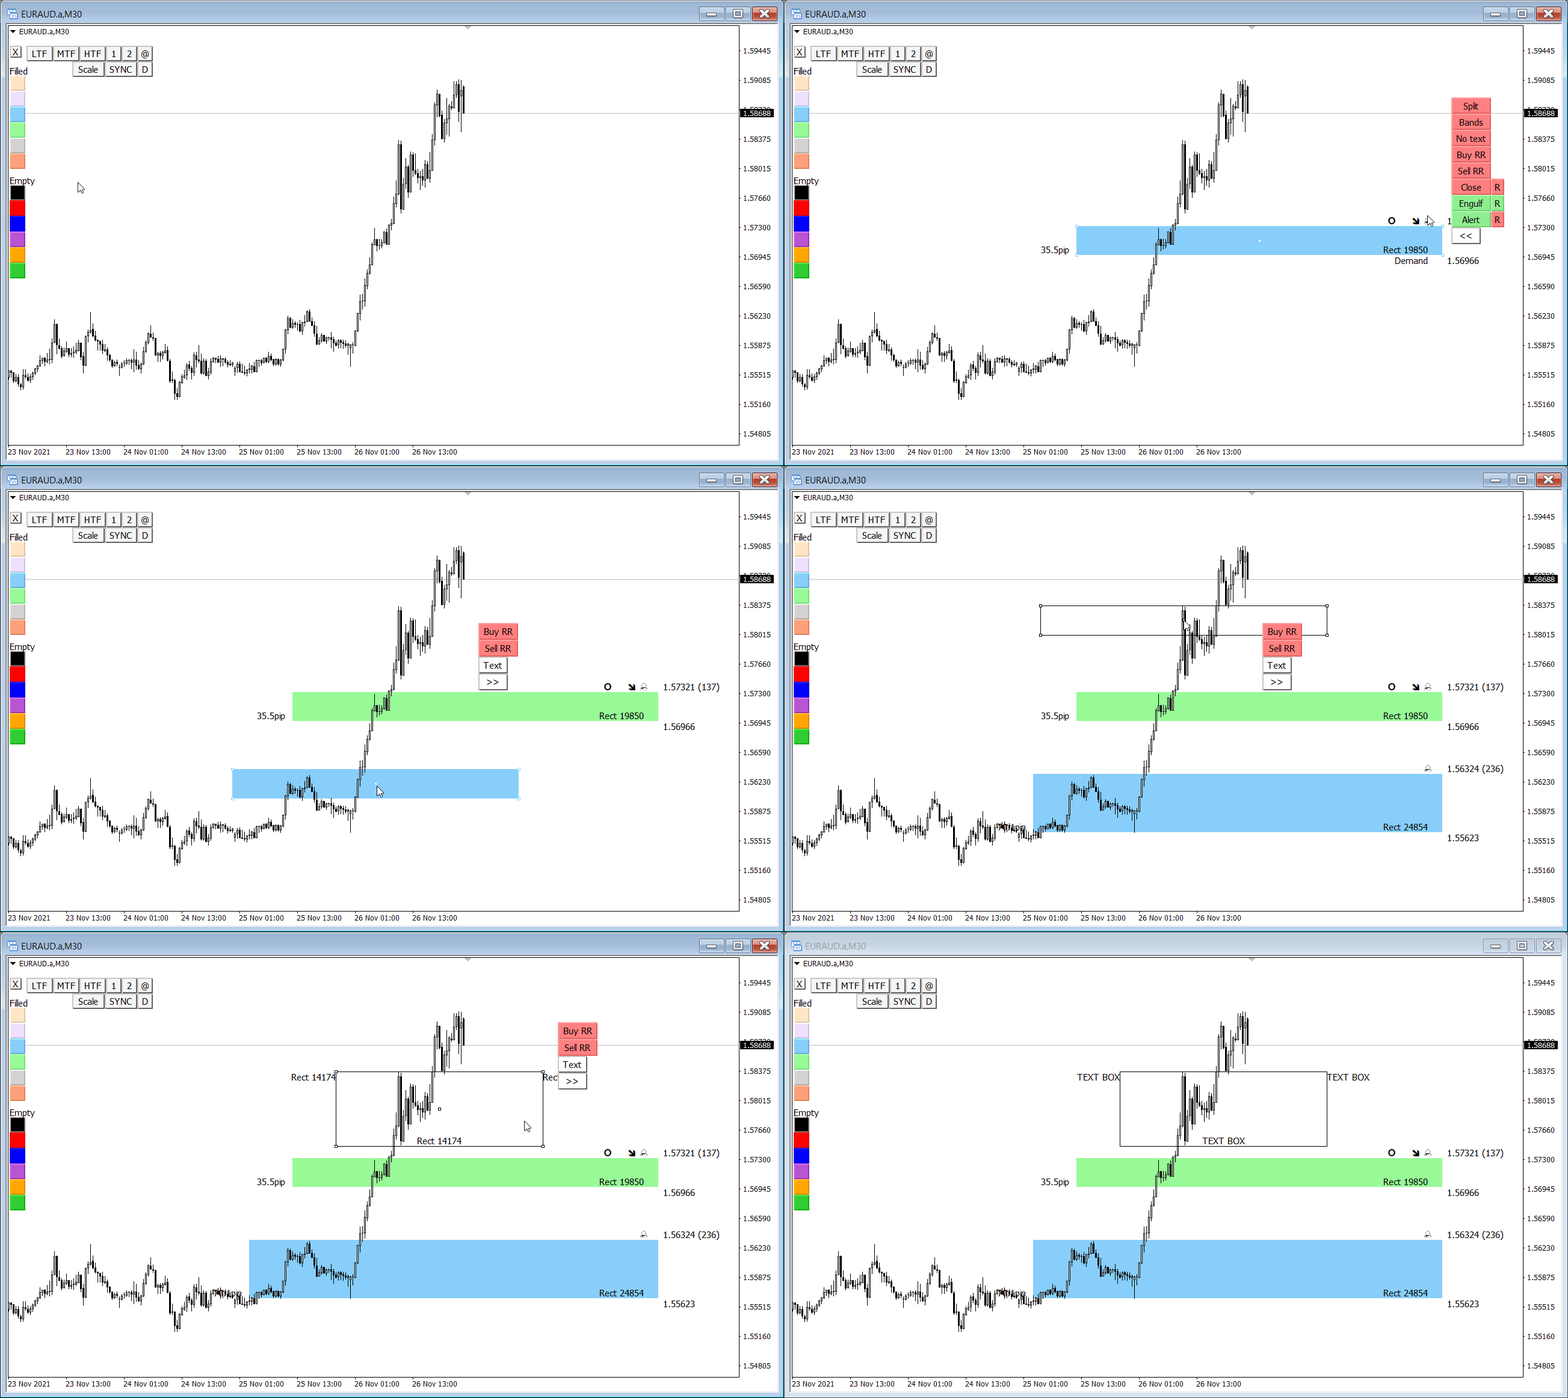
With click on button LTF, MTF or HTF, you can change timeframe visibility of selected objects. Configuration for each button can be changed with indicator input properties.
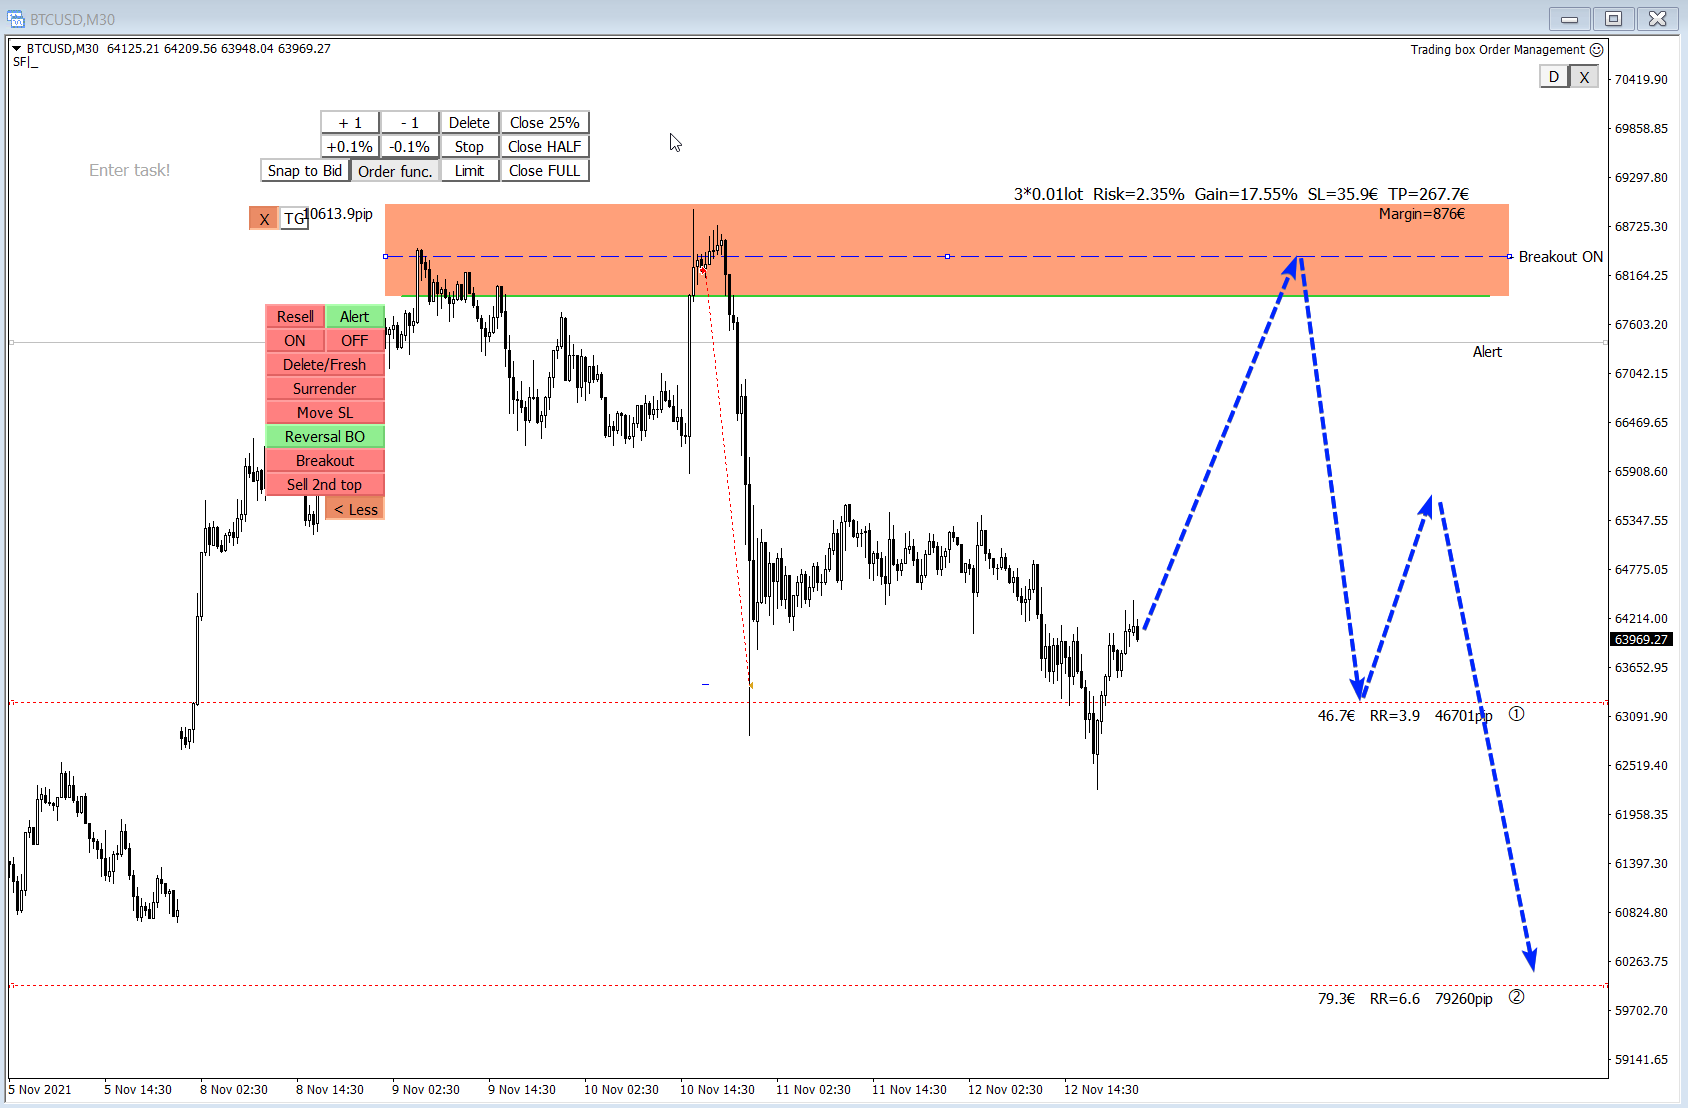
This tool will remove buttons and text labels from the chart, after you remove Trading box Order management or Trading box Technical analysis . You just need to drag this tool to your chart and after cleanup of objects is finished, the tool will remove itself from the chart. Please check images below that present Before and After using the Removal tool. There is also a short YouTube video at the bottom to show how easy it is to clean your chart after using Trading box tools. - input variable
This tool will remove buttons and text labels from the chart, after you remove Trading box Order management or Trading box Technical analysis. You just need to drag this tool to your chart and after cleanup of objects is finished, the tool will remove itself from the chart. Please check images below that present Before and After using the Removal tool. There is also a short YouTube video at the bottom to show how easy it is to clean your chart after using Trading box tools. - input variable
Free Download:
MT4: https://www.mql5.com/en/market/product/72876
MT5: https://www.mql5.com/en/market/product/72881
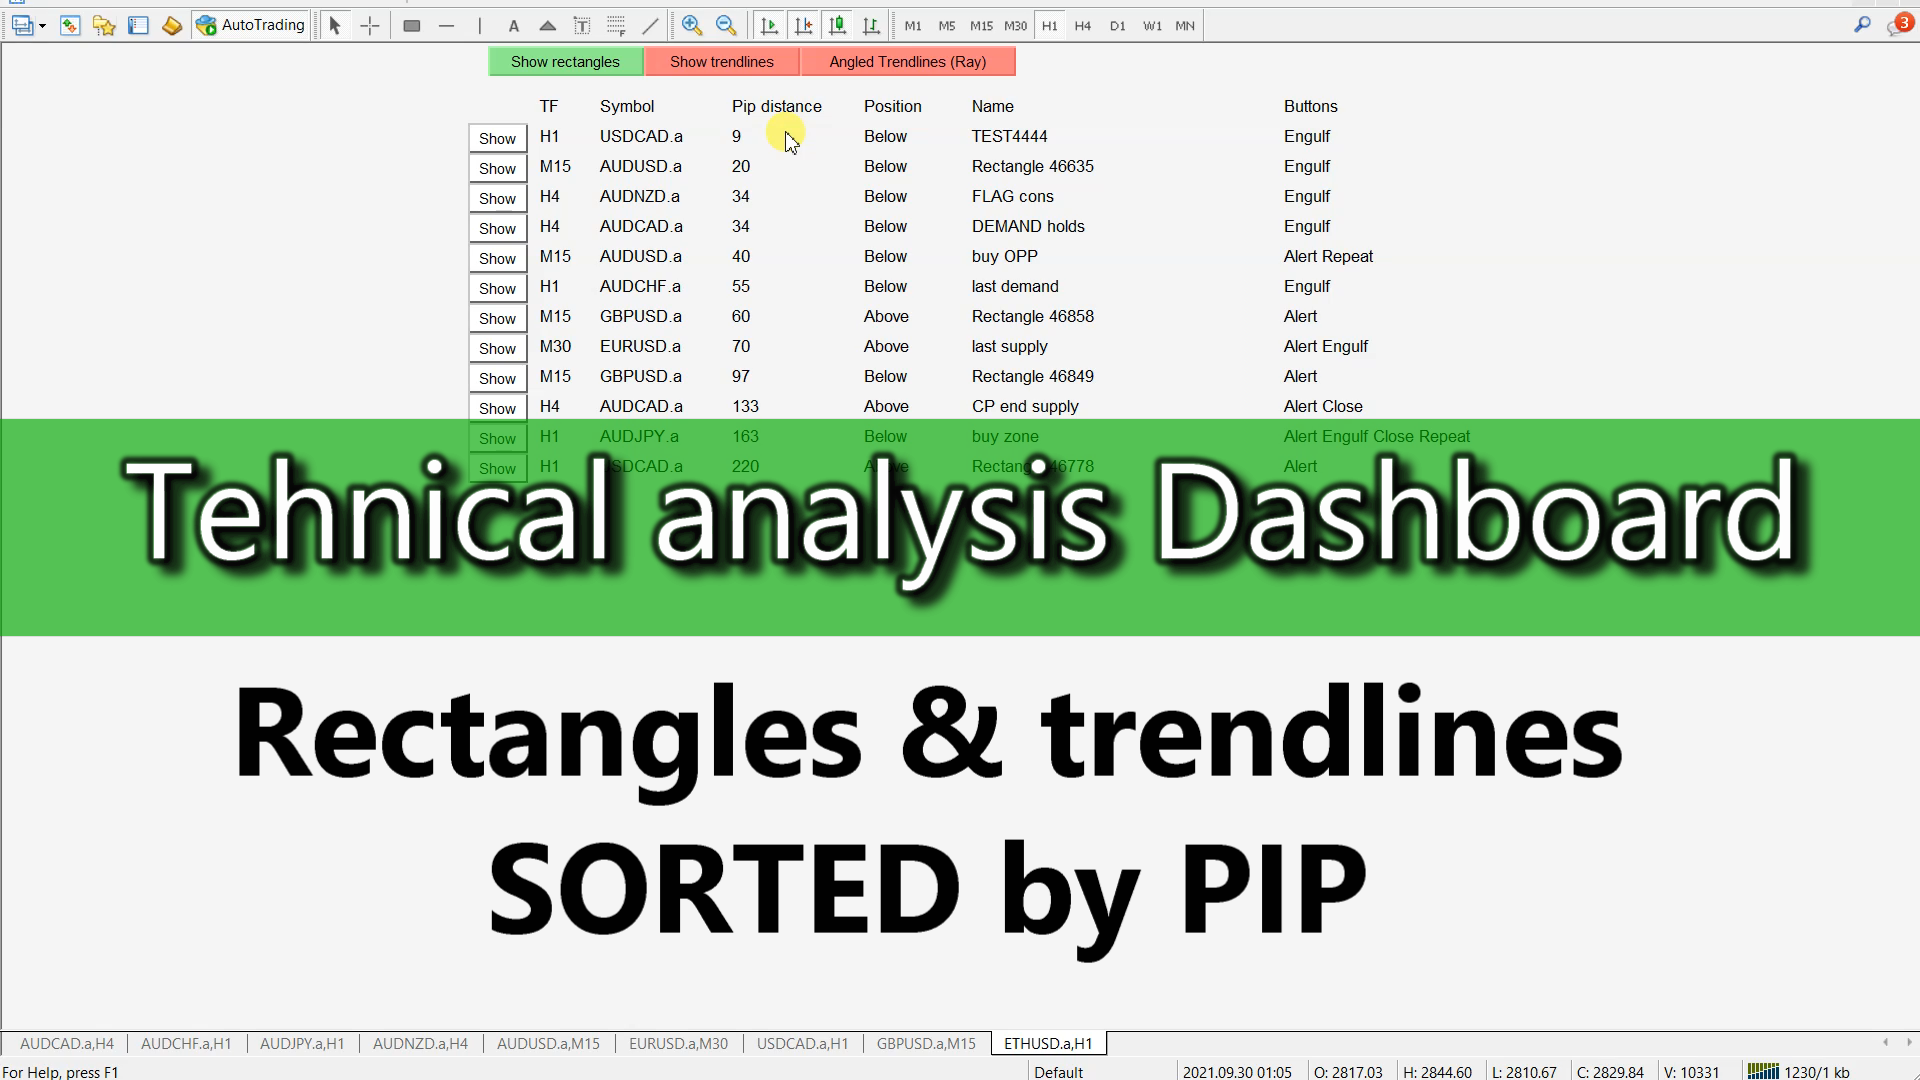
Display rectangles and trendlines list from Trading box Technical analysis tool. Objects are ordered in the list by pip distance that is difference between object price and Bid price. With this tool you will know which chart to look for next trading opportunity. No more switching between charts and searching for trades where price is close to rectangle zone or trendline support resistance level. Sorted Rectangles and Trendlines by pip distance - If you are trading on multiple
