Thiago Duarte / Profile
- Information
|
6+ years
experience
|
58
products
|
244
demo versions
|
|
8
jobs
|
0
signals
|
0
subscribers
|
I have been involved in the market since 2016 and I am brazilian.
I am founder and admin of Litoral Trading - community of market enthusiasts.
I work programming in MQL5 since March of 2019 and focus on MT5 to contribute with your growth.
Traveller and two wheels lover.
Do you want to automate some of your strategies? Contact me for a price!
Our pages:
▪️ YouTube: www.youtube.com/c/LitoralTrading
▪️ Linkedin: www.linkedin.com/in/thiago-duarte-184712177
▪️ Website: https://www.litoraltrading.com/
Donchian Channel is an indicator created by Richard Donchian. It is formed by taking the highest high and the lowest low of the last specified period in candles. The area between high and low is the channel for the chosen period. Its configuration is simple. It is possible to have the average between the upper and lower lines, plus you have alerts when price hits one side. If you have any questions or find any bugs, please contact me. Enjoy
Daily Projection Levels , as the name implies, is an indicator that project the price changes in percentage above and below the opening of the day (or closing of the previous day. These are "psychological" support and resistance areas where price tries to retrace or break out. With this you have a powerful tool to predict what these zones will be! You can define which projection levels you want (up to 5 above and below), in addition to have alert messages and visual customization. If you want to
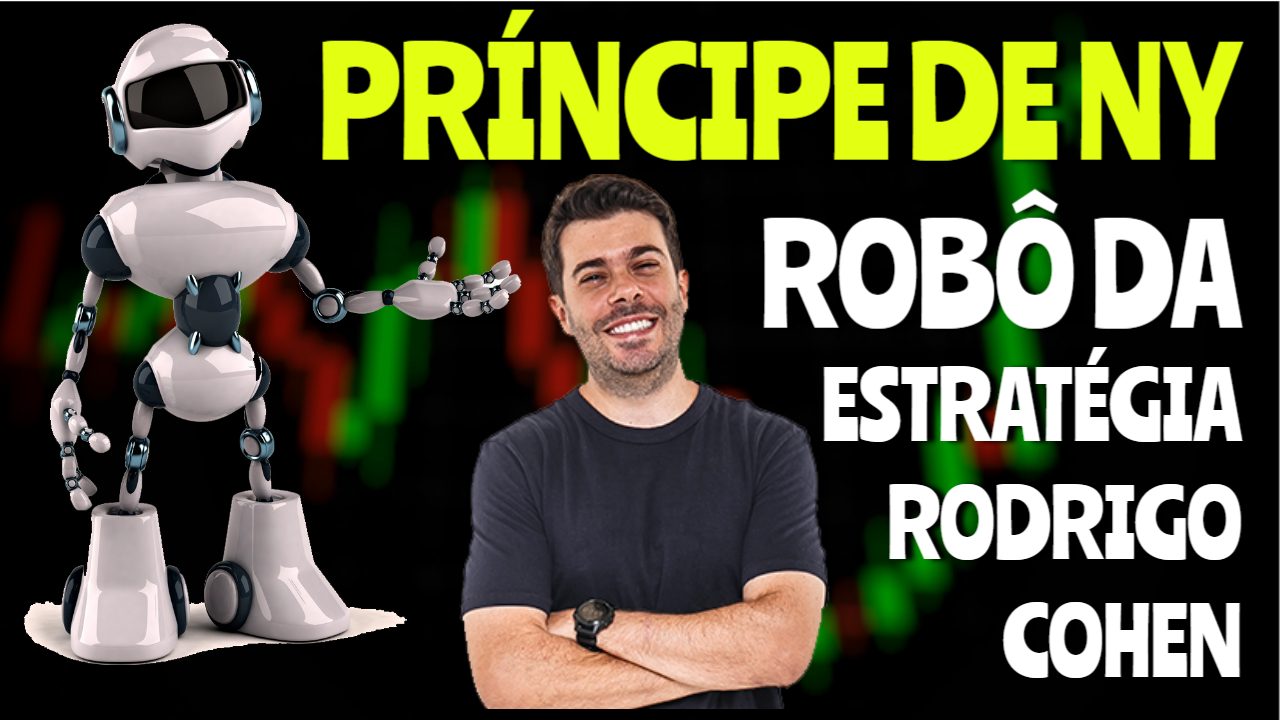
Nesse vídeo eu mostro como automatizar a estratégia Príncipe de NY do Rodrigo Cohen:
https://www.youtube.com/watch?v=K4Ax1WCcq70

Do you, like me, like to trade with the trend? Then this indicator will help you! Rainbow Trend is a trend indicator, which uses several Moving Averages on the chart. It measures different trend strenght zones for different periods: very long term, long term, mid term, short term and very short term. Each zone has its color, and it is possible to have sound alert when the prices leaves a zone and enters another. Its configuration is very simple. If you find any bug or have any suggestions
LT Colored Fibo is a simple indicator that paints the price zones between Fibonacci Retracement levels. Its configuration is extremely simple. It is possible to change the colors of each level of the retracement, choose between background or front of the chart and also work only with the current asset or all open. If you found a bug or have any suggestion for improvement, please contact me. Enjoy! This is a free indicator, but it took hours to develop. If you want to pay me a coffee, I
Easy Trend , as the name implies, is an indicator that easily shows the prevailing trend by bringing several indicators into one. The strategy is: when all indicators point in the same direction a signal is triggered. When red, is a signal to sell, when blue, signal to buy. It is that simple :) There are a total of 9 indicators: Moving Average, RSI, CCI, Parabolic SAR, William's Range, Stochastic, MACD, ADX and Heiken Ashi. It is possible to configure each of these indicators to suit your way of
I know, you have an idea for an EA and would like to develop your own without the need of a programmer? Then LT Sandbox EA will help you with that! As the name says (sandbox), you can configure it the way you want (within your limitations, of course). With it you can use up to 13 indicators, including an external indicator (from a third party), being able to make dozens of combinations! Available indicators: Moving Average (two of them) RSI Stochastic Oscillator MACD Bollinger Bands Parabolic
Candle Counter is a simple indicator that list the amout of candles in the day according to the current chart timeframe. It is specially useful for those teaching others how to trade, as it can draw attention to a specific candle of the day. Configuration: Reverse mode - if on, the actual candle is the first one. Position - Above or below the candles. Vertical distance - Vertical distance from the candles in pipets/points. Size - Font size. If you need help please don't hesitate to contact me
Protect My Trades is an EA (expert advisor bot) that automatically put stop loss and take profit on market trades and pending orders. You can specify if want it to do this only on actual symbol trades or in all others. Its configuration is very simple. Functions: Take profit: distance to TP (0 = disabled, no TP will be created). Stop loss: distance to SL (0 = disabled, no SL will be created). Price type: price type in pips or pipets/points (pips is common in Forex). Actual symbol only: manage
https://www.mql5.com/pt/code/25893
This is a tool in script type. It shows in chart the actual and/or past day ajust price in a horizontal line. The symbol name and it expiration must be set up according to the actual parameters. The lines appearance are fully customizable. You need to authorize the B3 url on MT5 configurations: www2.bmf.com.br. You need this to the tool can work. This is a tool for brazilian B3 market only
This is a utility indicator that creates mini charts on left side of the chart you are looking at. It is very useful to watch many timeframes simultaneously, without having to change between multiple charts. Its configuration is very simple. You can have up to 4 mini charts opened. They automatically load the template of the "parent" chart. If you have any doubt please contact me. Enjoy! This is a free indicator, but it took hours to develop. If you want to pay me a coffee, I appreciate a
Exaustion Oscillator: https://www.mql5.com/en/market/product/41924

zalo(0919289638) telegam
https://www.youtube.com/watch?v=ymxbY5aqzDg
History On Chart is an indicator that shows the "trail" of all trades made in a specific period of time. It shows the entry and exit point with their respective dates and prices. It also shows the type of trades and the cash result. Open trades are also displayed, but only the entry point. The indicator is free and fully customizable. If you have any questions please contact us. Enjoy! This is a free indicator, but it took hours to develop. If you want to pay me a coffee, I appreciate a lot
This is a script based tool that informs the swap from all the currency pairs (gold and silver too). It is possible to highlight pairs with a specific currency and whether the swap is positive or negative. In addition it is possible to complement the name of the symbols depending on the broker. The informations are showed in the Experts tab of the Toolbox (Ctrl+T). If you have any doubt or suggestion, please, contact us. Enjoy


