Vincent J Brug / Seller
Published products
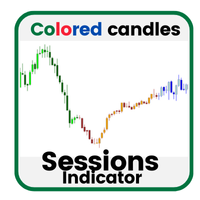
This sessions indicator displays trading sessions using colored candles. It’s designed for volume profile, supply/demand, and level-based traders who want to quickly identify when specific candles were formed during different sessions or times of day. Take a look at the screenshots for examples of how it can be used.
Core Features: Uses different colors for bullish and bearish candles to make them easy to distinguish.
Note: Make sure the candle colors are different from the chart background.
FREE
Monitor all 28 Forex pairs at once — clean mini charts, real-time price action, perfect for consistent price pattern traders. Designed for consistent, mechanical, and hybrid traders who repeatedly trade the same price action patterns — such as triangles, flags, trends, and supply/demand zones — across multiple symbols, without relying on indicators.
Core Features: Displays all 28 major Forex pairs in mini chart format , organized in a clean 4-row by 7-column layout. Powered by live price action
FREE
The Draggable Candle Timer is a smooth, minimal, and fully customizable tool that displays the countdown time until the next candle close. It is draggable and can be repositioned anywhere on the chart, so it never gets in the way. Alerts can be easily enabled or disabled directly on the chart by double-clicking the timer—no need to access the input settings. It runs smoothly, without the glitches and delays often encountered in other candle timers. To move the timer: Double-click to select it,
FREE
With the Chart Group indicator, you can link multiple charts so that changing the symbol on one automatically updates it on all linked charts. The Group ID appears in the bottom-left corner of each chart. Charts with the same Group ID are linked together as a single group.
How to Use: Attach the indicator to each chart you want to link. Drag and drop a symbol from the Market Watch onto any linked chart to update.
Note: This indicator does not work in the Strategy Tester
With the Chart Group indicator for MT5, you can link multiple charts so that changing the symbol on one automatically updates it across all linked charts. The Group ID is displayed in the bottom-left corner of each chart. Charts sharing the same Group ID are connected and function as a single group.
How to Use: Attach the indicator to each chart you want to link. Drag and drop a symbol from the Market Watch onto any linked chart to update them all.
Note: This indicator does not work in the Str