Roman Vashchilin / Profile
- Information
|
8+ years
experience
|
7
products
|
217
demo versions
|
|
0
jobs
|
0
signals
|
0
subscribers
|
I am a trader, in the trading sphere for more than 7 years.
Trading signals: https://www.mql5.com/en/signals/579871
------------------------------------------------------------------------------------------------------------------------------------
All my products MT4 / MT5: www.mql5.com/en/users/orelgrizli/seller
------------------------------------------------------------------------------------------------------------------------------------
My Signal's Facebook Page: www.facebook.com/OriginalForexSignal
------------------------------------------------------------------------------------------------------------------------------------
Advisor trading without indicators: https://www.mql5.com/en/market/product/28429
Scalping adviser with excellent performance: https://www.mql5.com/en/market/product/22936
Automatic drawing of all trends on the chart MT4: www.mql5.com/en/market/product/21892
This indicator works based on an improved system of triple moving averages (MA). In conjunction, this system is able to deliver impressive results in trading. The indicator is easy to use. It represents 2 arrows which are automatically drawn after a bar is closed, showing where the price is likely to move in the nearest future based on the combination of the signals from all MAs. What is Moving Average (MA)? It is one of the most popular, proven and efficient methods for Forex trading. Its
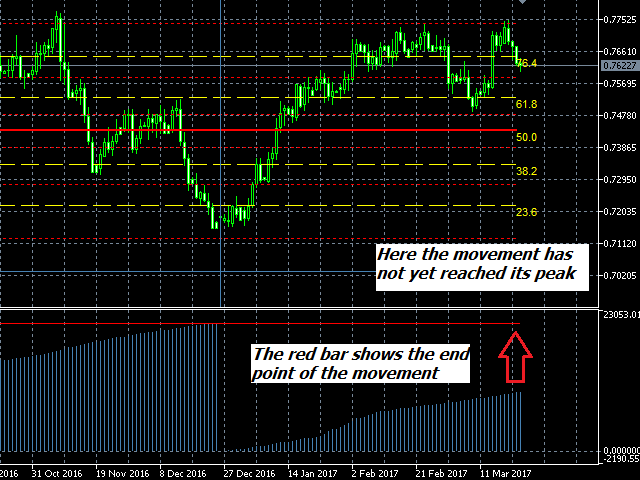
The principle of the indicator operation lies in the analysis of the currency pair history and determining the beginning and the end of the "power" driving the current trend. It also determines the Fibonacci levels in the main window. The indicator also shows how long ago the local Highs and Lows have been reached. How to Use Waves in the subwindow show the strength and the stage of the trend movement. That is, if the waves only start rising, then the trend is in the initial stage. If the waves
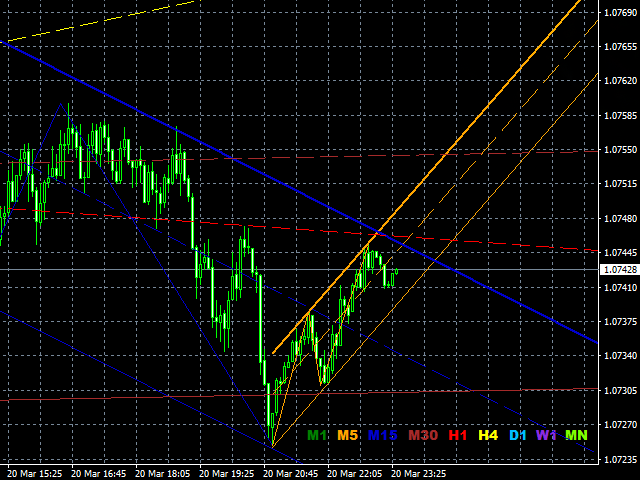
Flow Of Lines The indicator calculates and shows on a symbol chart trend channels, as well as the price movement channels, each of which corresponds to its specific timeframe. This method provides easy analysis of long- and short-term trend movement dynamics. In addition to all of the above, the indicator displays breakouts and the presence of a strong trend in the digital format (on the right top of the table). The lines that serve as the channel borders, can be at the same time used as certain


