|
10+ years
experience
|
0
products
|
0
demo versions
|
|
0
jobs
|
0
signals
|
0
subscribers
|
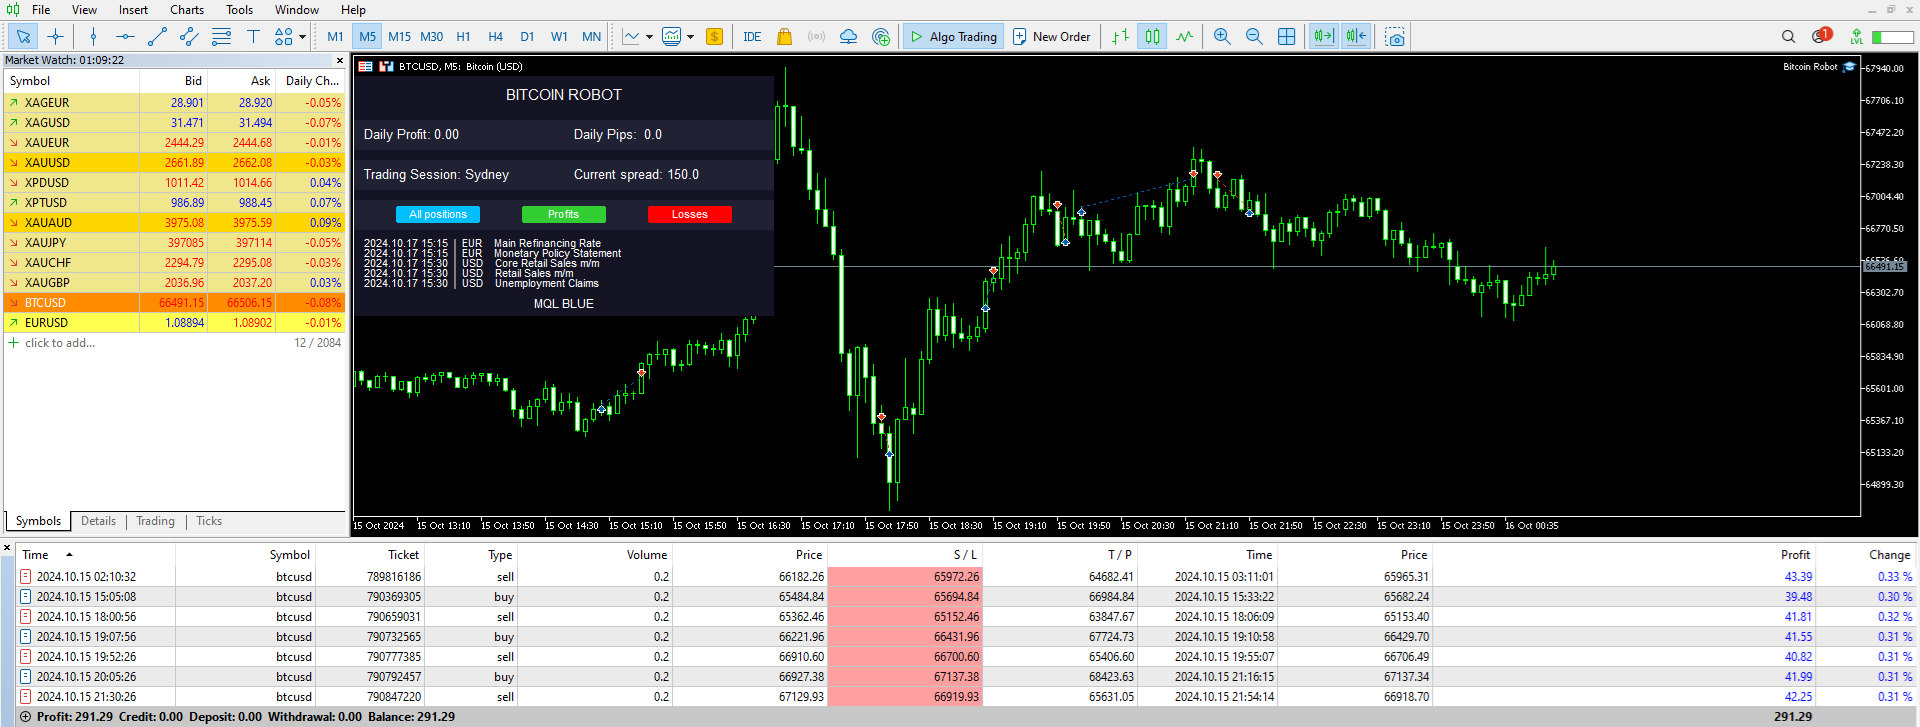
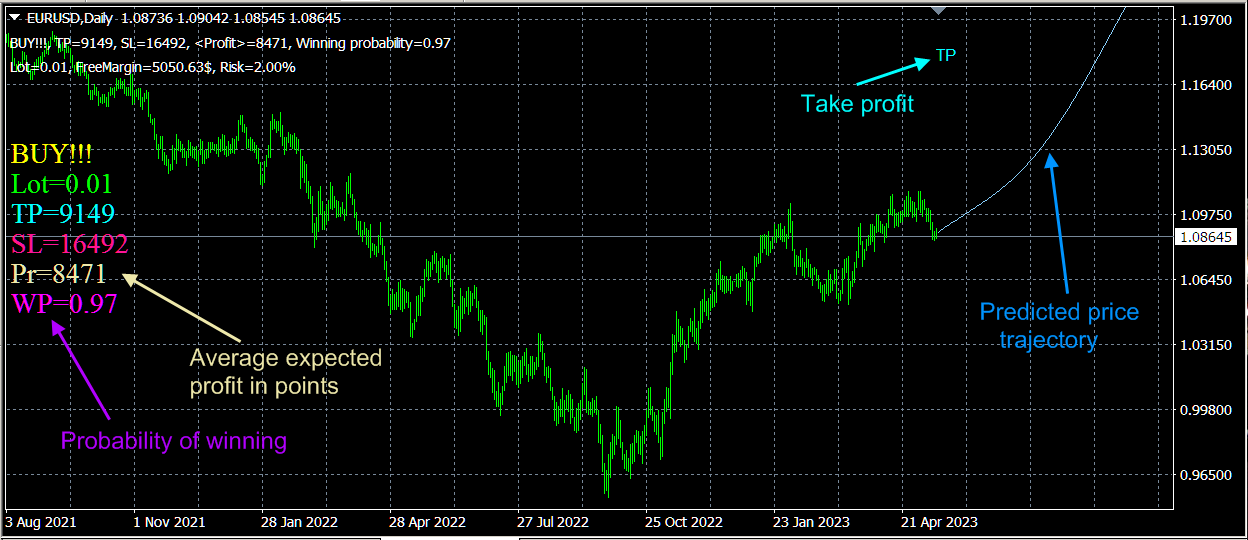
I'm self-taught trader started trading since 2007. Trading in major currency pairs, gold and some US indices.
I am using RoboForex as main broker for all my trade.
I am using RoboForex as main broker for all my trade.