Namu Makwembo / Seller
Published products

Rubdfx Spike Indicator 1.5: Updated for Strategic Trading The Rubdfx Spike Indicator is developed to aid traders in identifying potential market reversals and trends. It highlights spikes that indicate possible upward or downward movements, helping you observe when a trend may continue. A trend is identified when a buy or sell spike persists until the next opposite spike appears. Key Features: Versatility: Any Timeframe Adaptability: Designed to work on all Timeframes however Recommended for

Bobot AI is a sophisticated automated forex trading program that utilizes advanced algorithms to analyze market data and make predictions about future price movements. Our system is designed to quickly identify patterns and trends in the market, allowing you to make informed trading decisions. With automatic trade execution and a risk management strategy in place, Bobot AI empowers you to trade with confidence and ease Our focus is on helping traders make better-informed decisions and providing
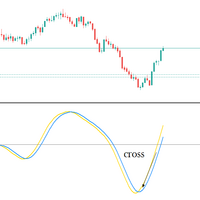
Big promotion on the Robos, Get yours now Robos Indicator The ROBOS indicator is a multi timeframe oscillator that targets the overbought and oversold regions of a price chart, a signal is indicated by the two lines crossing, compatible with all tradable instruments
Latest Release
The latest release is the version 4.0
#What's new in version 4.0 ?
Features
Extreme oversold and overbought levels
ROBOS version 4.0 comes with cool new feature , the ability to target on
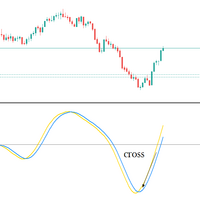
Upgraded version 1.5 , Arrow added on to indicate Buy and Sell Signal, The indicator is an ossicaltor that targets the highest buying and lowest selling levels , the signal indicated by the two lines crossing above and below zero line 0 HOW IT WORKS? Buying : you want to place your buy Entry when the yellow line is above the blue line ; stop loss just a few pips below the swing low , take profit when the lines cross again - A Buy arrow will also appear when the crossing appears Selling: yo
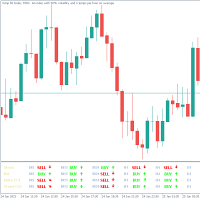
The Trend Assistant indicator is a technical analysis tool that helps traders identify the current trend of a financial instrument by analyzing different timeframes on a chart.
The indicator shows the trend based on M1 (1 minute) , M5 (5 minutes) , M15 (15 minutes) , M30 (30 minutes) , H1 (1 hour) , H4 (4 hours) , D1 (1 day) , W1 (1 week) , and MN1 (1 month) timeframes. The trend is represented by a colored arrows on the sub window chart, with a bullish trend shown in green and a bearish tre

RubdFx Perfect Reversal , The reversal indicator is used to determine areas of support and resistance by Drawing an arrow with a level of supply and demand ( ReversalZones ). - You will catch more swings by reducing the period, and less swings if you increase period - Mobile, computer and email alerts available . it is not pushed by price which means the arrow will stay in one place,suitable for scalping and long term trading Also Compatible with all forex paris , BUY RULES; open a buy positio
Big promotion! , prices are now on discount , get your copy now The Rubdfx Price Tracker that is used to show price price bound , the price almost never goes out of the channel and most of the time price will react when it touches the channel limits .It determines the best highest and lowest prices at which you can sell and buy respectively Suitable for scalping & swing trading It Draws arrows that appear after a candle close , The arrows indicate bullish or bearish pressure For bearish an

The Rubdfx swing indicator is a useful tool for traders looking to identify trend changes in a particular instrument they are trading. It is designed to draw a line on the main chart, and the signals are indicated by color changes with signal alerts. The color green is used to indicate a bullish trend, while the color pink is used to indicate a bearish trend. These colors can be customized to fit the trader's preferences or theme. The Rubdfx swing indicator has the ability to spot both long-te

Upgraded version 3.4 Supply and Demand Indicator , it determines levels of supply and demand by using algorithm such as order blocks , engulfing candle patterns , etc. Signals are visually indicated when the levels are drawn on the chart
Trendline touch and Candle Strick Patterns can also play a role to add as confluence when making trading decisions including `reversal patterns` etc Compatibility : All tradable Instruments ; Currency Pairs, Synthetic indices ,Metals, Crypto, NASDAQ et

The rubdfx divergence indicator is a technical analysis tool that compares a security's price movement. It is used to identify potential changes in the price trend of a security. The indicator can be applied to any type of chart, including bar charts and candlestick charts.
The algorithm is based on MACD, which has been modified to detect multiple positive and negative divergences. Settings
___settings___ * fastEMA * slowEMA * signalSMA *Alerts: True/False
#Indicator Usage
B

Version 1.0 The Trend Snatcher is Multi timeframe indicator that can be used to catch swings on the price market chart The indicator uses two lines that targets the highest buying and lowest selling levels , the signal indicated by the two lines crossing The indicator is suitable for scalping and Swing trading, It can also be used as additional Confluence to enter a trade when Price is at a significant level of supply and demand or Trendline touch
HOW IT WORKS? Buying : Place your Buy

Upgraded - Stars added to indentify Areas you can scale in to compound on your entry when buying or selling version 2.4 Upgraded Notifications and alerts added version 2.3 *The indicator is suitable for all pairs fromm Deriv pairs (Vix,jump,boom & crash indices) , Currencies, cryptos , stocks(USA100, USA30 ), and metals like gold etc. How does it work?
Increasing the period make it more stable hence will only focus on important entry points However lowering the period will mean the indica

RUBFX Trend histo mt5 , indicator works on synthetic indices, Currencies , Indices ,Stocks Gold etc , good for follwoing trend on the markets suitable for scalping Buy Rules; When the histo changes to Blue you place buy order ,stop loss just below the previous swing low Sell Rules; When the histo changes to Red you place sell order ,stop loss just below the previous swing high Trade on a timeframe which best suits your trading style
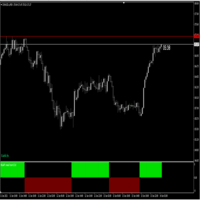
Follow Trend indicator , indicator works on Currencies , Indices ,Stocks Gold etc , good for follwoing trend on the markets suitable for scalping Buy Rules; When the histo changes to Blue you place buy order ,stop loss just below the previous swing low Sell Rules; When the histo changes to Red you place sell order ,stop loss just below the previous swing high Trade on a timeframe which best suits your trading style