Jabbar Ganji / Profile
This is the 60-seconds free demo version of Easy Chart Shifter. You can find the full version on: https://www.mql5.com/en/market/product/49695 Easy Chart Shifter (60-sec demo version) This indicator is made to make the moving the chart easier. By it, you can simply drag the chart in all 4 directions using the mouse. If you monitor is touch screen, you can use pen or finger also. You can shift the chart in both vertical and horizontal directions, using the mouse/pen/finger (for touch
Easy Chart Shifter This indicator is made to make the moving the chart easier. By it, you can simply drag the chart in all 4 directions using the mouse. If you monitor is touch screen, you can use pen or finger also. You can shift the chart in both vertical and horizontal directions, using the mouse/pen/finger (for touch monitors). You can reset the chart position/zoom by double-clicking on it
This is the 60-seconds free demo version of Easy Chart Shifter. You can find the full version on: https://www.mql5.com/en/market/product/49690 Easy Chart Shifter (60-sec demo version) This indicator is made to make the moving the chart easier. By it, you can simply drag the chart in all 4 directions using the mouse. If you monitor is touch screen, you can use pen or finger also. You can shift the chart in both vertical and horizontal directions, using the mouse/pen/finger (for touch
Easy Chart Shifter This indicator is made to make the moving the chart easier. By it, you can simply drag the chart in all 4 directions using the mouse. If you monitor is touch screen, you can use pen or finger also. You can shift the chart in both vertical and horizontal directions, using the mouse/pen/finger (for touch monitors). You can reset the chart position/zoom by double-clicking on it
https://www.mql5.com/en/market/product/49328

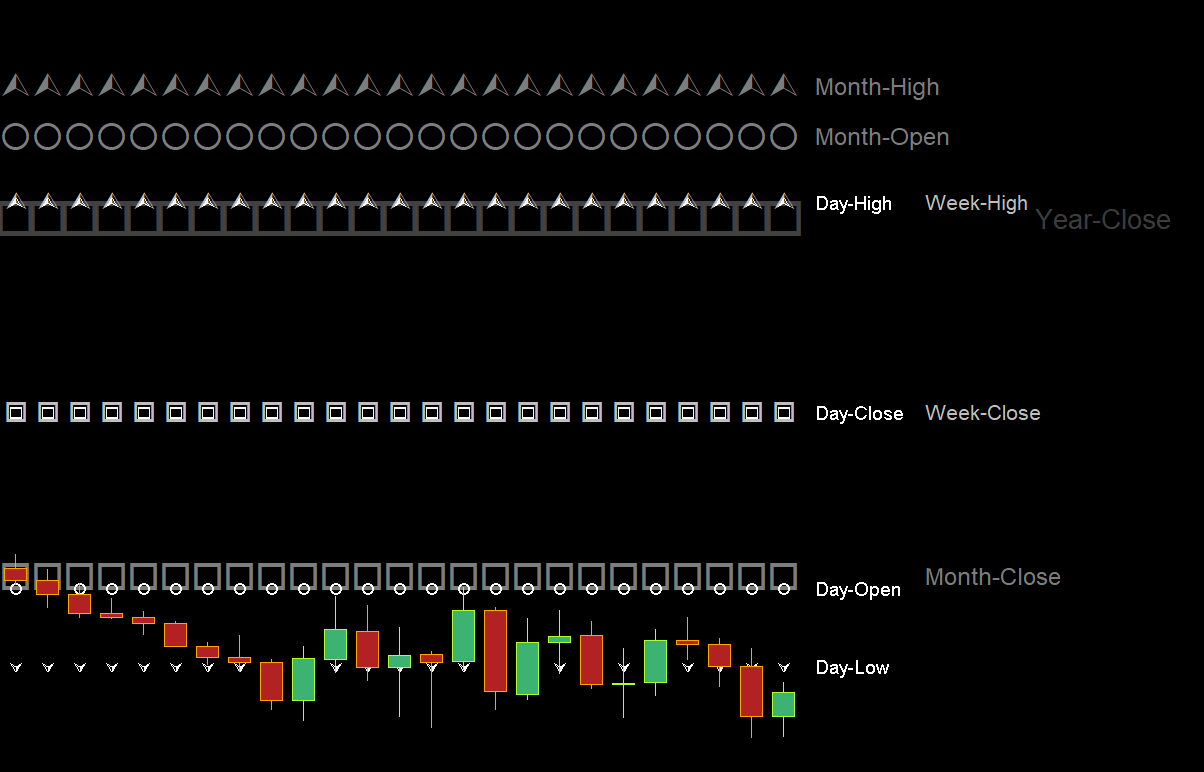
This indicator shows the price levels (Open/High/Low/Close) of the higher periods (Daily/Weekly/Monthly/Yearly) of : the current period (shift of 0) / or the previous period (shift of 1) / or even the past periods (shift of 2 or higher). As we know, these price level act as the natural support/resistance levels and can be used in the price-action strategies. You can use this indicator on all timeframes. On each timeframe, it shows the higher timeframe price-lines only. By default, the drawing


