Johannes Schoeman / Seller
Published products

Does your trading consist of Multiple EA's, Multiple time frames an no clear indication of how each individual strategy or time frame is performing, then this indicator will help. Assign the EA Magic number to this indicator and track it's performance on the chart by selecting on chart the period, today, week, month year or all history to view. Easy visual colour changing header to display the performance of the EA for the respective periods. Minimize the panel to reduce chart clutter. Add yo
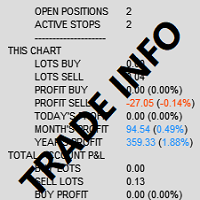
Trade and Account Information Panel The Trade Info Panel allows you to easily see the status of you trading by pair and account. Minimise the panel by clicking on it to reduce the display area. Easily Identify loosing pairs/ instruments traded by the change of header colour. The HEADER change colour should the months losses exceed the months gains.
Displayed information: General Account information Account Leverage Spread Bar Time remaining Account Balance Account Equity Margin Free Margin Acc
The EA is based on price crossing the High or Low of a Moving Average. Advance Fractal profit taking method. Advance stop management option based on explosive candles (Big Candles). Loss recovery system making recovery of losses easier. Configured the EA to match your trading style. Scalping, Swing Trading or Trend Trading. Three custom trailing stop options. Explosive candle stop management with partial closure. Advance fractal partial close profit taking Two indicator filters Time filter wit
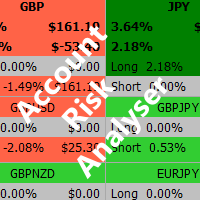
Account Risk Analyser, allows you to keep track of your account risk, risk exposure to individual pairs and risk on base currency pairs. Get notified when your risk on a base currency pair exceed a predetermined risk level. Get notified when your account exceed a predetermined risk level. Risk Analyser based on the NNFX methodology of not over leveraging on any base pairs. Parameter inputs Percentage risk trigger for Trade instruments Percentage risk trigger for Account Alerts Chart Alert Mail A
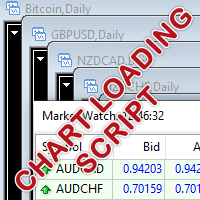
Run the script with your selected timeframe and template to apply it to all the symbols available in your Market Watch window.
Select the symbols you wish to trade from your Market Watch window. Run the script on any one chart with your selected time frame and template. Press "OK" and all your selected symbols will load with the selected timeframe and template.
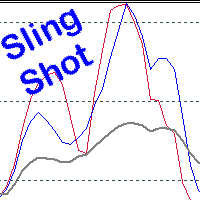
Scalping, Mean reversion or Position trading strategy
Get into an established trend on a pullback in the market. Use the Pinch in the indicator for profit taking. Use the Pinch as a mean reversion strategy, scalping back to a moving average line.
Input Parameters Fast Sling Shot configuration. Slow Sling Shot configuration. Dual Sling Shot configuration. Price line configuration. Trigger zones or levels. Example of Sling Shot trade idea: Price line sets the mood, below the baseline leve
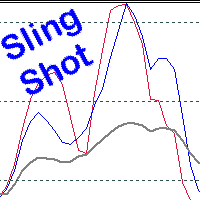
Scalping, Mean reversion or Position trading strategy
Get into an established trend on a pullback in the market. Use the Pinch in the indicator for profit taking. Use the Pinch as a mean reversion strategy, scalping back to a moving average line.
Input Parameters Fast Sling Shot configuration. Slow Sling Shot configuration. Dual Sling Shot configuration. Price line configuration. Trigger zones or levels. Example of Sling Shot trade idea: Price line sets the mood, below the baseline level (50)
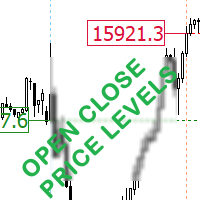
This indicator displays the open and closing price for the selected number of days. Easily identify market open and close Gaps. Select the Day icon to show the open and closing price line. Select the Time icon to show the open and closing hours. Indices and stocks are not a 24hour market as shown on MT5 charts, they open and close at specific times. Marketplace
Time Zone
Trading Hours
New York Stock Exchange (NYSE)
EDT
9:30 a.m. to 4:00 p.m.
Nasdaq Stock Market
EDT
9:30 a.m. to 4:00 p.m.
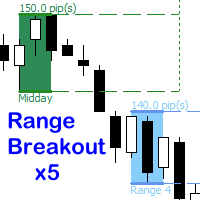
Trade multiple time range breakouts.
This EA offers up to 5 different time range zones all individually customizable. Bracket one candle or a whole range of candles. Enable all five ranges or just one. Each range have individual stop loss, break even or take profit options. Select the number of historical breakout zones to display on the chart. Each breakout zone indicates the number of pips in the range. Customise each range label in the EA, this will be displayed in the comments section of th