Oleksandr Martsynyshen / Seller
Published products

The indicator determines the best moments for entering the market.
It is written on the basis of well-known indicators such as Alligator and CC I. For fine-tuning, it contains all the parameters of parents. The indicator works on all timeframes.
The basic setting of the indicator is performed by changing the values of two parameters "Precision" and "CCI Period". All other parameters can be left unchanged.

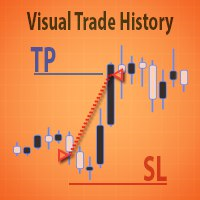
Visual Trade History Visualizer of trading history. The graph displays the levels of SL, TP, points of entry and exit from the market.
Features :
It is possible to display only orders with a profit greater than a given number. There is the ability to display only executed orders or not executed, or all. For convenience, the analysis for each type of order, you can configure your own color.

Description:
- D ay Pattern - an indicator that helps to identify patterns of price changes for the development of trading algorithms and strategies.
For whom this tool?
- For developers of trading strategies and algorithms.
- Medium- and long-term traders. Time frames H1-W1.
Features of the indicator:
- There is a function of exporting indicator values to a file of the csv format.
- Using the information panel, you can conduct an express analysis of trading tool.
- The indicat

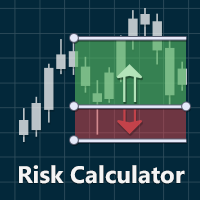
The Visual Risk Calculator is the indicator that allows calculating the risks, before placing an order.
Features:
- Calculation of potential profits and losses in points, interest and in the base currency, including the brokerage commission.
- calculation of the ratio of profit to potential loss.
- informing about the calculated levels of stop-loss and take-profit.
- the ability to drag the levels of entry into the market, stop-loss, and take-profit on the graph for preview before pl

Range Volume Profile The indicator Range Volume Profile shows the distribution of transactions on the price scale in a given time range. This tool simplifies the analysis of the market situation and helps to find the price levels where a large player is sitting. Features: shows the distribution of tick volumes relative to the price. shows the distribution of real volumes relative to the price. If your broker provides them. you can select the part of the chart that you want to explore. for cert