Dian Kemala / Profile
- Information
|
11+ years
experience
|
0
products
|
0
demo versions
|
|
0
jobs
|
0
signals
|
0
subscribers
|
CEO
at
Forex Learning Center
a former flight attendant, and CEO of Forex Learning Center Indonesia, currently studying economy and finance. A financial technical analyst, full-time trader and also signal provider
https://www.mql5.com/en/signals/35115
https://www.mql5.com/en/signals/35115
Friends
51
Requests
Outgoing
Dian Kemala


from daily chart, we can see triangle already break, and right now, retest 61.8 fibonacci at 19.703 level. We also see bearish butterfly will perform to reach potential reversal zone at 22.361 as bullish target. and this pattern will failure if price break bellow fibonacci 88.6 at 18...
Share on social networks · 3
355
Dian Kemala


Geopolitical tension may perform gold back in to saveheaven, fist bullish target at 1360.38 as last gartley target profit and major bullish target at 1411.83 at 1411.83 as previous gartley point...
Share on social networks · 2
194
Dian Kemala


This pair still trap in equilibrium for almost 5 month. as long as this pattern not break, 175 pip range, from 102.70 to 100.95 still best choise with good risk and reward ratio. If we look from smaller timeframe, Price already reject from major fibonacci support at 101.82,. but if 102...
Share on social networks · 2
152
Dian Kemala


Geopolitical tension in Ukraine and russia will drive in to energy crysis, this situation is very bad for GBP and EURO. From technical analysis, strong Channel Up from sept last year finally break and also break fibonacci support level at 1.6875. Bearish will getting strong if 1.6700 break...
Share on social networks · 1
162
Dian Kemala
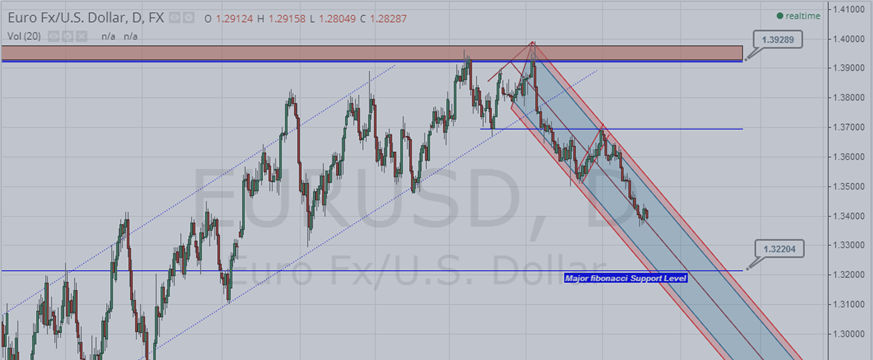

This pair rejected from fibonacci 1.141 support at 1.3336 level. There still no sign of bullish yet, new fibonacci 61.8 resistance level at 1.3400. If the price cannot break this level, this week bearish 1.272 fibonacci target at 1.3319. Trend reverse to bullish only if 1...
Share on social networks · 1
151
Dian Kemala


From daily chart, this pair are still in channel down, and major target for bearish at major fibonacci support at 1.3220 level. If we look inside smaller timeframe, new resistance level perform at fibonacci 61.8 at 1.3440 with target at 1.3322...
Share on social networks · 2
166
Dian Kemala


Channel Up pattern break and success to perform Head and shoulders pattern. Break and retest at 174.20 with 5 fibonacci PRZ. This pattern projection target at 170.94, and failed if price success to break 174.58...
Share on social networks · 2
153
Dian Kemala
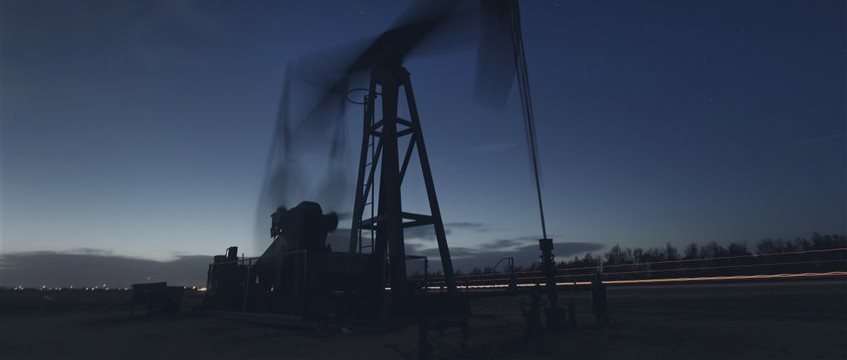

Bullish scenario on crude oil still perform, key level area between 97.46 - 99.32 are very important level as classsic support and resistance since aug 2012, fibonacci support level from jan 2014, and Support channel up pattern since Jul 2012...
Share on social networks · 1
142
Dian Kemala


Bullish analysis on aussie still continue from last month, traping inside 224 equilibrium may break up and reach target at 0.9552, if 0.9324 as minor fibonacci support level not break. From the smaller timeframe, there is two Bullish scenario, Entry long at fibonacci retracement 0...
Share on social networks · 5
171
Dian Kemala


Pressure from seller may drag gold to 1282 from 1310 at fibonacci resistance. This level is important, because there is 61.8 major fibonacci and 127.2 PRZ. If rejection happen from 1282, Bullish will continue to reach 1363 as major fibonacci target...
Share on social networks · 2
198
Dian Kemala


From daily chart, we can see there is two important level, Daily fibonacci support and double bottom. If there is a correction from support channel pattern, 138.16 will be maximum target. As long as this channel not break, gartley will continue perform to 135...
Share on social networks · 2
124
Dian Kemala


From Weekly timeframe, big triangle pattern perform and price reject from Major Resistance at 61.8 Fibonacci. If this pattern continue, 1.1621 Will be primary downtrend target for next few years. Fibonacci Level at 1.3220 will be first support level, and if this level break 1...
Share on social networks · 1
141
Dian Kemala
Published post Technical Analysis Crude Oil, 18 July
CL found support level at fibonacci 50% inside channel up pattern. 105.03 will be resistance level, and if this level break Ideal target for this ABCD at level 109.37...
Share on social networks · 3
104
Dian Kemala
Published post Technical analysis EURJPY 18 July
Downtrend will tested at double bottom and fibonacci support level. Euro fundamental still in bad result, and MH17Plane Crash on ukraine border make this level easy to break. At 4 hour chart,, strong channel down still perform...
Share on social networks · 4
223
Dian Kemala


Bad result of euro fundamental force this pair to break median line of bullish flag on weekly chart. there is only 2 level of reversal, at double bottom or major fibonacci at 0.7292 In smaller timefame H4, we can see gartley perform with 0.7866 target,.. and double bottom at 0.7741...
Share on social networks · 2
123
Dian Kemala
close all position,.. withdrawal all profit and keep balance at $8000 ^_^
https://www.mql5.com/en/signals/35115
https://www.mql5.com/en/signals/35115
Dian Kemala

I Hope it touch 61.8
Sergey Golubev


Gold prices have steadied on Tuesday, as the spot price stands at $1309.23 per ounce late in the European session. Gold slipped about 2% on Monday, as the pair fell close to the $1300 level. On the release front, Monday's highlights are Core Retail Sales and Retail Sales...
4
:


https://www.mql5.com/en/job/new?prefered=z.babe