Alexander Nikolaev / Seller
Published products
This EA sets pending trades based on the Parabolic indicator, while analyzing the readings of the stochastic and other indicators so as not to set pending trades when the market is not suitable. As a rule, it trades a market reversal when the parabolic point is broken. In addition, it can find divergences on the MACD indicator (if CountBasrsDiv>0) and trade only if there are divergences (and convergences). It has many settings, the stop loss can also move along the parabolic. Recommended curren
This Expert Advisor works on the signals of the Parabolic indicator, while analyzing the readings of other indicators, especially Stochastic. Sets pending orders, as a rule, they are triggered when a local trend reversal occurs. If the trading conditions become unsuitable, it can delete pending orders. It has many settings, the stop loss can also move along the parabolic with other parameters.
Recommended timeframes: M5, M15, M30, H1. Before trading, optimize the EA parameters for your accoun

Some candles have a strong tendency to continue the movement or to revert it. With the help of the Colored candles indicator such movements are clearly visible. This indicator calculates the parameters of each candle, as well as its volume, and after that it paints the candles depending on its strength and direction. Bullish candles are colored green and bearish candles - red. The greater the power of the bulls or the bears, the brighter the color. You can change the colors if you want. The indi
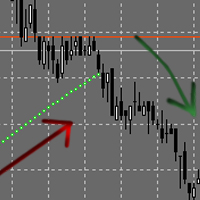
The Expert Advisor places orders based on the points of the Parabolic Sar indicator. If your trading strategy utilizes this indicator, the EA will save you from the necessity to move your pending orders after every candlestick (e.g. 5 minutes or 1 hour) and will do it automatically. You can set the EA to open only BuyStop or only SellStop or both. Buy default both Buy and Sell are enabled. The EA does not use any indicators other than Parapolic Sar. Therefore you are to decide the time to run th
FREE
This Expert Advisor finds the direction of the trend of the currency pair on a given number of bars, after that, it determines the moment of the correction. If the trend is strong enough, and the correction becomes equal to the one specified in the parameters, then the EA trades in the direction of the trend (but only if additional indicator readings confirm the opening of a trade). Since this EA works on corrections, it will not buy at the high or sell at the low of the trend. It has many sett
This adviser finds the trend of the currency pair on a given number of bars, after that, determines the time of the correction. If the trend is strong enough, and the correction becomes equal to the one set in the parameters, the adviser can open a trade in the direction of the trend, if additional indications of indicators confirm the opening of the trade. This is good because it will not buy at the high or sell at the low of the trend, but only after the correction. Nevertheless, it is possibl

The indicator helps to enter a trade following the trend, at the same time, after some correction. It finds strong trending movements of a currency pair on a given number of bars, and also finds correction levels to this trend. If the trend is strong enough, and the correction becomes equal to the one specified in the parameters, then the indicator signals this. You can set different correction values, 38, 50 and 62 (Fibonacci levels) are better. In addition, you can set the minimum trend lengt
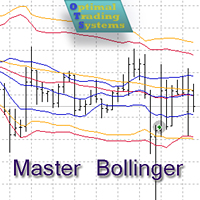
The Expert Advisor opens and closes positions using Bollinger Bands signals: it buys on lower bands when price rolls back, and it sells on upper bands. It has the option to close positions by an opposite signal, by take profit and stop loss, move a trade to breakeven upon reaching the central Bollinger band or after a certain price movement. Many good strategies use one or more Bollinger Bands indicators. In this EA, it is possible to use up to 3 such indicators. When using the first and second
This Expert Advisor adjusts to changes in the movement of the currency pair on history and automatically optimizes some parameters to follow the changes in the market. It calculates which candles, levels and indicator readings are most suitable for a given period of history and finds the parameters for opening a position at the moment. This allows you to optimize the parameters manually less often and trade longer without losses despite market changes. However, not all parameters are automatica
This Expert Advisor is able to independently adjust to a volatile market. It determines the best parameters for trading by counting over a certain history which candles, levels and indicator readings are most suitable for opening a position. This makes it possible to optimize parameters manually less often and, probably, to trade for longer without losses despite the market changes. However, not all parameters are automatically optimized, it is necessary to set deviations of indicators from the

This Expert Advisor trades according to a trend, using several methods for determining it and entering a trade. It has no complicated settings to make it easier for beginners to understand or not to spend a lot of time for experienced traders. In addition to trading, it can also display the trend lines on the basis of which it trades. The adviser sets a stop loss and take profit for each trade; it does not have risky trading methods. It is recommended to use on EUR/USD, GBP/USD currency pairs a
This Expert Advisor trades based on trend lines, as well as on the basis of volume analysis. Volumes are calculated using minute bars, in order to determine if they were ascending or descending. The trend lines are drawn based on High and Lows in the trade history. There are also additional indicators. Buy or sell signals depend on all those factors. This allows the EA to enter the market with more accuracy and to perform more deals.
Input parameters Lots - lot size (if 0, a lot is calculated
The Expert Advisor looks for the bars followed by price rises or falls. It analyzes how often rises and falls occur after similar bars and makes trades based on that analysis. The market changes frequently but the EA is able to adapt to the changes performing analysis right during trading.
Input Parameters Lots - lot size (if 0, a lot is calculated based on the percentage of account free margin); Percentage of free money - the percentage of free margin to open each new trade (applicable when L

Volume Levels is a very important indicator for exchange trading. Most of the trades were performed on those levels. This indicator displays the price level that had the most trade volumes over a certain period of time. Often, the price bounces from those levels in the future, and it can be successfully used in trading. This is a demo version that works only on the USD/JPY currency pair. To work on all currency pairs, install the full version: https://www.mql5.com/en/market/product/15888
Param
FREE
The EA detects strong movements using the Parabolic indicator and opens a trade. The Commodity Channel Index (CCI) is used as an auxiliary indicator. The CCI levels may depend on the ADX indicator values, which allows for better trading with different volatility. Also, the trades are opened depending on the RSI indicator values on a certain timeframe. Recommended timeframes: M5, M15, M30. Make sure to optimize the parameters of the EA for your account before trading.
Input Parameters Lots - lo

The demo version of the Colored Candles indicator - calculates the parameters of each candle, as well as its volume. After that, it paints the candles depending on their strength and direction. Bullish candles are colored green and bearish candles - red. The greater the power of the bulls or the bears, the brighter the color. You can change the colors if you want. The indicator helps to analyze the price movement, as well as market entry points. The more accurate signals are formed on the higher
FREE

Some experienced trades can tell where the price will go even without indicators, as the direction of the price can be found using the ordinary candlesticks. The EA compares several nearest bars and their volumes, and opens a trade based on that data. Also, it is able to analyze the candles on two timeframes at the same time to make the entry more accurate and less risky. In addition, the EA can automatically determine the take profit and stop loss size depending on the size of the previous cand

This is a simple and free Expert Advisor that trades candlesticks. It compares several nearest bars and their volumes, and opens a trade based on that data. Unlike the professional version , it analyzes only 1 timeframe. The recommended timeframes for this EA are H1, H4, D1, it works with any currency pairs. The parameters always need to be optimized before trading, as well as after some period of trading.
Input Parameters Lots - lot size (if Lots=0, then the lot will be calculated based on th
FREE
It is good to know the presence of a trend on multiple timeframes at once. And even better - on multiple currency pairs at once. This indicator allows to quickly determine the presence of a trend or a flat on 8 timeframes and from 1 to 15 currency pairs at once. Multi Alligator Signals analyzes the signals of the Alligator indicator by Bill Williams on every timeframe (from M1 to W1) and multiple currency pairs (up to 15) simultaneously. If there is a buy signal, a green upward arrow is drawn, i
Volume Levels is a very important indicator for exchange trading. Most of the trades were performed on those levels. This indicator displays the price level that had the most trade volumes over a certain period of time. Often, the price bounces from those levels in the future, and it can be successfully used in trading. It works on any currency pair.
Parameters HistoryBars - the number of bars to determine the near volume levels; Range - the maximum distance above and below the current price t

The indicator draws lines the the price highs and lows. Break through the high or low usually indicates trend change (or continuation). Once the price moves through a line, and the candlestick closes, the indicator draws an appropriate arrow (also, you can enable alerts). A deal should be conducted in the breakthrough direction immediately or after a slight rollback. It is best to trade following the trend on a larger timeframe. This indicator is easy to use, but nevertheless, there are many tra
FREE

ADX Channel is an indicator that plots the channel depending on the values of the ADX (Average Directional Movement Index) indicator. The resulting channel is a little similar to the Envelopes, but its lines depend on the market volatility. The sell trade is usually executed fast when the price touches and bounces from the upper line of the channel, buy - from the lower. It is recommended to trade when there is no significant news. The recommended timeframes: M5 - H1. The indicator is not design
FREE

This indicator finds and displays the Double Bottom and Double Top technical analysis patterns. Signals (displays a message on the screen) if the shape was formed recently. Often after the appearance of these patterns, the trend reverses or a correction occurs. In order not to search for them yourself, or not to miss their appearance, it is enough to add an indicator to the chart. The indicator can be used on different timeframes and currency pairs, there are settings for a better search on a c
FREE
This EA finds technical analysis patterns that often appear before a trend reversal: Double Bottom, Triple Bottom, Head and Shoulders and their opposite counterparts. The Expert Advisor is able to identify them on the chart of a currency pair and trade when the pattern has been formed and it has been broken through. Also, in order to trade excluding unnecessary signals (for example, with weak volatility), you can adjust and optimize the readings of some indicators (Stochastic, ADX) and the filte
This Expert Advisor is the free version of "Bollinger with WPR scalper", which is based on the Bollinger bands and Williams' Percent Range indicators. Limitations of the free version: lot is fixed to 0.01, only the EURUSD currency pair is supported, trading time cannot be selected, trailing stop is not available. Nevertheless, it can make quite a lot of deals, so you do not have to wait for positions to be opened (with the appropriate settings and timeframes below H1). The EA can be used on time
FREE
This EA finds technical analysis patterns that foreshadow a trend reversal: "Double Bottom", "Triple Bottom", "Head and Shoulders" and their opposite analogs. The Expert Advisor identifies them on the chart of a currency pair and trades if the pattern has been formed and has been broken through. In addition to the figure itself, the volatility of the currency pair and the readings of some indicators are determined. This allows you to trade more correctly, excluding unnecessary signals, for exam
This indicator finds technical analysis reversal patterns such as Double Bottom, Triple Bottom, Head & Shoulders and their opposite counterparts. The indicator shows them on the chart of a currency pair and can signal a trader if a pattern has been formed recently. This allows you to quickly detect a possible trend reversal or correction, it is enough to add an indicator to the chart, after that, you can change different timeframes to quickly find such patterns, if the patterns are not located
This EA identifies trading candles that often foreshadow a market reversal and finds volume accumulation levels in the trading history. It opens trades if a candlestick like "Doji" or "Engulfing" appears at the volume level and the price seems to be repelled from the level. To make its strategy clearer to users, it can display volume levels and signal candles (thanks to its good display, it can be used as an indicator). In the strategy tester, some display functions do not work correctly, so wat
The indicator determines and plots price channels or lines, reading information from multiple timeframes (from current, second and third) simultaneously. Color and width of lines for each timeframe can be customized. It is also possible to set different distance between the Highs and Lows for plotting channels or lines.
Parameters History - maximum number of bars to plot channels or lines; Distance - minimum distance from one High (or Low) to another when plotting lines; Shift - shift for seve
This indicator finds the "Double Bottom" and "Double Top" technical analysis patterns, shows them on the chart of the currency pair and can signal if the pattern was formed recently. These patterns are reversal, often after the emergence of the trend turns back or a correction occurs. In order not to search for them yourself, it is enough to add the indicator to the chart, after that, you can change different timeframes in order to quickly find such figures on one of the timeframes. There are so
FREE

The indicator analyzes the chart and identifies Doji candlesticks. Shows their appearance and signals the appearance of such a candle (if allowed in the parameters). Also, this indicator shows the strength of the reversal in the form of bars of different colors (the more green, the more likely the rise, the more red - the fall in price). The direction of the signal depends on the direction of the previous candles, as the Doji signals a reversal or correction. In the indicator settings, you can
FREE

Free indicator to quickly detect trendline breakouts and high or low of a price range. It displays lines based on the highs and lows of prices, and also finds and displays inclined trend lines. As soon as the price goes beyond the line and the candlestick closes, the indicator signals this with an arrow (you can also enable an alert). This indicator is easy to use and also free. The number of candles for defining trend lines as well as the high and low of the trading range is configurable. It w
FREE

This indicator is able to determine the price levels at which there was the most volume for the specified period of history. In the future, the price often bounces off such levels, and this can be successfully applied in trading. They are displayed as lines, some parameters for determining the levels can be adjusted. This indicator is simple, therefore, it does not report signals, and only builds levels on EUR/USD. Parameters
HistoryBars - the number of bars to determine the near volume levels;
FREE
This indicator is able to determine the price levels at which there was the most volume over the specified period of history. In the future, the price often bounces off such levels, and this can be successfully applied in trading. They are displayed as lines, some parameters for determining the levels can be adjusted. This indicator is an improved version of Volume Levels, it notifies you when the price rebounds from the level, and can also notify you when the level is touched. In addition, this
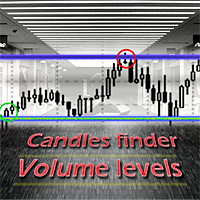
This Expert Advisor finds volume accumulation levels in the trading history and also identifies Doji and Engulfing candles, which often foreshadow a market reversal. If such a candlestick appears at the volume level and the price seems to be repelled from the level, the EA opens a trade. In addition to trading, it can display volume levels and signal candles to make its strategy clearer for users (and can also be used as an indicator). The Expert Advisor has many settings for optimization, so th
Volume levels are an important indicator for stock trading. In the past, most of the trades were made at these levels, or these trades were made by large traders. In the future, the price often bounces off such levels, and this can be successfully applied in trading. This Expert Advisor is able to determine volume levels based on trade in history. It is based on an indicator that displays levels: https://www.mql5.com/en/market/product/65562 , but besides displaying, it can trade from levels. In
Volume Levels is a very important indicator for exchange trading . At such levels, the majority of transactions were made. In the future, the price often bounces off such levels, and this can be successfully applied in trading. This indicator is able to determine the levels at which there was the most volume over the specified period of history. These levels are shown as lines, and the parameters for determining the levels are configurable. In addition to displaying, this indicator can inform th
This EA trades when the trend line, or high (low) price is broken. Trend lines and extremes are found by the specified parameters. In addition to trading, it also displays these lines on the chart. A trade occurs when the price goes outside the line and the candlestick closes. Also, the advisor may not trade if the market has low volatility, or other filters do not allow it to do so in order to cut off non-profit trades. It can set a stop loss in a parabolic pattern, or use a simple trailing st

A breakout of a trend line, as well as a high or low, usually signals a change (or continuation) of the trend. This indicator displays lines at the highs and lows of the price, as well as finds and displays inclined trend lines. As soon as the price goes beyond the line and the candlestick closes, the indicator signals this with an arrow (you can also enable alerts). This indicator is easy to use, however, there are many trading strategies that are based on trendline breakouts. The number of ca
This EA forms a channel based on the readings of the ADX indicator (Average Directional Movement Index), and trades from the boundaries of this channel when the price reversals. This channel is displayed on the chart of the currency pair. A sell trade is executed when the price touches and bounces off the upper channel line, a buy - from the lower one. At the same time, it can filter entries to trades depending on the readings of other indicators: Stochastic, ATR and RSI. The channel drawn by th

This indicator forms a channel based on the readings of the ADX (Average Directional Movement Index) indicator, displays and informs the trader of a price reversal at the boundaries of this channel, and can also report when the price touches the channel boundaries. It also draws additional dotted lines, which depend on the readings of the + DI and -DI of the ADX indicator. It also has an option for filtering signals depending on the readings of the stochastic. The channel drawn by this indicato
FREE
This Expert Advisor draws a channel based on the readings of the ADX indicator (Average Directional Movement Index), and trades from the boundaries of this channel when the price reversals. A sell trade is executed when the price touches and bounces off the upper channel line, a buy - from the lower one. At the same time, it can filter trade entries depending on the readings of other indicators: Stochastic, ATR and RSI. The channel drawn by this indicator turns out to be a bit similar to Envelop
This EA finds price movement channels on the chart and also identifies Doji and Engulfing candles. The EA trades when such a candle appears at the channel border (it can not only bounce off the borders, but also break the channel), and can display the channels and candles that it trades. To show examples of candles and for some settings, a menu has been made on the left of the chart. The Expert Advisor also has signal filtering by stochastic and moving average, it has many settings to optimize t
This indicator determines the channels along which prices move on the trading history. There are many trading strategies that rely on channel trading on a channel breakout. This indicator can draw price channels by reading information from several timeframes at once (from the current, from the second and third). You can customize the color and thickness of the lines for each timeframe. Also, you can set a different distance between highs and lows to draw channels or lines. There is also a simple

Volumes are one of the most important factors of trading, as it is the high volumes that move the market in either direction. But there are very few standard indicators for volumes in MetaTrader 4. The Volume Candles analyses the volumes of the trades and displays candles depending on these volumes. The candle appears once the required number of volumes has passed during trading (the VolumeCandle parameter). If the candles close frequently and are thin, then the volumes on the market are current

The Expert Advisor identifies Doji candles on the chart and opens trades when they appear (if they meet the specified parameters). In addition, the EA can also trade with the Engulfing candles. It can display the candles it is trading on, it also shows how the signal candle is set up. The exact settings of the signal candles can be changed and optimized. Also, the Expert Advisor has settings for additional indicators for filtering trade entries and can analyze trading volumes, so that, for exam

The indicator draws lines based on the price Highs and Lows, as well as slant trend lines. Break through the trend line, High or Low usually indicates trend change (or continuation). Once the price moves through a line, and the candlestick closes, the indicator draws an appropriate arrow (also, you can enable alerts). This indicator is easy to use, but nevertheless, there are many trading strategies, which are based on a breakthrough of the trend lines. The number of candlesticks used to determi
The EA trades by finding Doji candles on the chart. Displays the candles it is trading on and also shows how the signal candle is set up. This version of the EA can also trade with the Engulf candles. The exact settings of the signal candles can be changed and optimized. In addition, this version can analyze trading volumes, so that, for example, to ignore signals when there was little volume. Also, the advisor has settings for additional indicators for filtering trade entries.
The EA can tra

The indicator searches for and displays Doji candlesticks on the chart and signals the appearance of such a candle. The direction of the signal depends on the direction of the previous candles, as the Doji signals a reversal or correction. In addition to the possibility of signaling, the power of the reversal is graphically shown (the more green, the more likely growth, the more red, the price will fall). In the indicator settings, you can change the parameters of the Doji candlestick, the closu
FREE
This EA is easy to use, it does not have too complicated settings and algorithms for performing trading operations. It’s not optimized for long, it may appeal to those who recently decided to engage in trading on the exchange with the help of advisers, or who do not want to understand the settings for a long time. The basis of his work is several indicators (moving average, RSI, stochastic, ATR). Despite its simplicity, it has a custom trailing stop function, which can reduce the risks for a dep

This EA works on the basis of channels formed by price. It trades from the boundaries of these channels (for example, when the price breaks through the border of the channel, or when it touches and comes back). It can also display the lines and channels through which it trades. They are built on the highs and lows of prices. The EA has customizable parameters for trading on multiple channels and uses some indicators to improve trading (for example, Stochastic or ADX). It also has parameters for
This adviser trades on the signal of the Bollinger Bands indicators: it buys at the lower levels when the price rebounds, and sells at the upper. Has the ability to close positions on the return signal, take profit or stop loss. Many traders use the Bollinger Bands indicator, and some use several Bollinger indicators on the same chart. In this adviser, you can use up to 3 of these indicators. When using the first and second indicators, the transaction will be carried out between the lines of the
This EA trades with the trend using several methods to identify and enter a trade. For example, it uses trendlines, Gator and Stochastic indicators to analyze the market. In addition to trading, it can also display trend lines that it trades based on. It has filters for ADX and MA indicators, as well as a sufficient number of settings to be able to optimize on various currency pairs and timeframes.
The EA sets stop loss and take profit for each trade, does not have risky trading methods. It i

This indicator draws price channels. Easy to use. It has various settings, for example, you can configure it to show channels only for buy or sell, you can display trend lines instead of channels. There are many trading strategies that are based on trading in channels, you can trade on the rebound from the borders of the channels, or the breakdown of the channel. Parameters History - the maximum number of bars for building channels; Distance - the minimum distance from one maximum (or minimum
A ColdStream trading expert can identify strong trend movements. It uses different indicators, for example Alligator, Gator and many others, besides it determines and can display trend lines by the highs and lows of the price, to trade when these lines break through. It has many customizable parameters so that you can optimize this Expert Advisor for better trading on the necessary currency pair or timeframe. At the same time, you can use almost any currency pairs for trading. It is advisable to

This Expert Advisor analyzes the last candles and determines whether there will be a reversal or a large correction. In addition, the readings of the MACD and RSI indicators are analyzed (their parameters can be adjusted). After analyzing the indicators, when their readings confirm a trade, the transaction opens in the right direction and closes on the opposite signal, take profit or stop loss. To reduce losses and increase profits (with good trading), you can adjust the change in lot depending
A trader cannot always discover what the last closed bar is by volume. This EA, analyzing all volumes inside this bar, can more accurately predict the behavior of large players in the market. In the settings, you can make different ways to determine the volume for growth, or for falling. This adviser can not only trade, but also visually display what volumes were inside the bar (for buying or selling). In addition, it has enough settings so that you can optimize the parameters for almost any ac
Some candles have a strong tendency to continue the movement, or its turn. Using the Colored candles and patterns indicator, such candles are clearly visible. This indicator calculates the parameters of each candle, as well as its volume, and after that it colors the candles depending on its strength and direction. Bullish candles turn green and bearish candles turn red. The greater the strength of the bulls or bears, the brighter the color. If desired, the colors can be changed. In addition, t
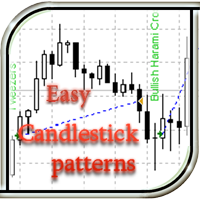
This EA recognizes candlestick patterns, opens trades depending on the last candlestick pattern, and also displays its name (when the ShowInfo option is enabled) directly on the chart of the currency pair. There are also additional indicators whose parameters are adjustable (for example, ADX volatility indicator, dynamic stop loss parameter, trailing stop). The EA can determine both simple models consisting of 1 candlestick, and complex ones from 2 to 5 candles. The simple version of this advise
FREE
This is an adviser that analyzes the volumes inside the last closed bar and trades based on these volumes. It can more accurately predict the behavior of large players in the market, as it determines the volume to buy or sell not by the bar on the current time frame, but by the bars of the lower time frames inside the bar (candle) of the current time frame. In the settings, you can make different ways to determine the volume for growth, or for falling. Unlike the pro version , the free version h
FREE
If you are tired of trading, why not have a little fun right in the MT4 terminal? Try this game, the rules are simple - you need to control the ball and take a coin. The ball jumps along the line of the moving average, and it is controlled by arrows or the keys "w a s d". Try to keep the ball from falling out of bounds. There are several levels of difficulty, if at first it’s difficult, you can set a simple level, and when you train, increase difficulty.
When adding a game to a window with a
FREE
This utility is a full game with a ball on a chart of a currency pair. The ball jumps along the line of the moving average, and it is controlled by arrows or the keys "w a s d". Try to keep the ball from falling out of bounds. There are several levels of difficulty, if at first it’s difficult, you can set a simple level, and when you train, increase difficulty. In this version, there are many more levels and there is an adversary who is chasing you.
When adding a game to a window with a chart
A trading adviser that not only trades, but also has a built-in game. The EA trades on signaling bars and MACD and RSI indicators. The ATR indicator is used to determine volatility. Many other customizable options are available. An interesting feature is the built-in free game in which you need to control the ball and collect coins. The ball jumps along the line of the moving average, you need to control it with the arrows or the "w a s d" keys and not let it fall outside the playing area (2 re
FREE
This Expert Advisor is an improved version of Master Bollinger Bands and has more settings; it can set stop loss per parabolic. Added parameters to improve optimization (for example, to discard profitable settings, but with a small number of transactions).
Like the regular version, the adviser can close positions by a return signal, take profit and stop loss, set the transaction to breakeven when it reaches the center line of Bollinger or at a given value. It can use up to 3 Bollinger indicat
This adviser analyzes the candles, determines their strength and volume. It trades when there is a high probability of continuing a trend that has formed a little earlier (based on several candles, the number of which is adjustable). Has the ability to use several methods for analyzing the strength of movement by candlelight. Many options are customizable. Input parameters Lots - lot size; MinProfitForAutoClose - automatic closing of a transaction upon a return signal when the profit in points
FREE
The Light Pullback Breakout Trading can determine the breakdown of price highs and lows and trade after a small pullback (depending on settings). It does not use risky methods, there are not as many settings as in the advanced version , but this EA is free and can trade on all currency pairs and timeframes. There are various settings for finding lines and filters for transactions. Full (extended version): https://www.mql5.com/en/market/product/41327 Differences from the free one: customizable
FREE
This trading adviser determines the breaking of the maximum or minimum of the trading range, as well as a small rollback of the price after breaking. The number of candles in the trading range can be customized. The transaction is completed after the rollback, as well as after confirmation of the opening of a position by different indicators. The parameters of most indicators can be adjusted (and also disabled some filters if you need to make more transactions). The trading range for determining
Moving averages are very often used for analyzing currency pairs and trading. This Expert Advisor can analyze many moving averages at once and trade based on this. When the required number of moving averages signal a purchase, the adviser makes a purchase, if the indicators signal a sale, the advisor sells. Also, there is filtering spurious signals at low volatility based on the ADX indicator. In the settings of the adviser, you can set the required number of sliding ones, their period (the init
This trading advisor works with strong movements of currency pairs. He can use different indicators for trading, calculate and draw trend lines according to the extremes of the price movement. It is a free, simplified version of ColdStream Expert Advisor, it has enough customizable parameters for optimization, but a little less than in the full version. Also, the maximum lot is limited to 0.1. Nevertheless, you can use almost any currency pairs and timeframes for trading. Do not forget to optimi
FREE

An Expert Advisor who is able to draw trading channels based on the highs and lows of prices and trades from the borders of these channels (when the price breaks through the boundary of the channel, or it touches and comes back). It has customizable options for trading on multiple channels and uses some indicators to improve trading (so that there are fewer trades). It also has options for improving optimization and for managing orders. It is possible to customize the trailing stop (both normal

The indicator draws price channels. It can be customized so that only buy or sell channels are displayed. Also, trend lines can be displayed instead of channels. This indicator is easy to use, but nevertheless, there are many trading strategies based on channel trading. Advisor based on this indicator: https://www.mql5.com/en/market/product/37952 Parameters History - maximum number of bars to build channels; Distance - minimum distance from one High (or Low) to another when constructing a chann
FREE
This Expert Advisor analyzes the last candles and determines whether there will be a reversal or a large correction. Also, the readings of some indicators are analyzed (their parameters can be adjusted). Is a free version of Proftrader . Unlike the full version, in the free version of the adviser the initial lot cannot be higher than 0.1, trading pair only EURUSD and also it has fewer configurable parameters. Input parameters
Lots - lot size (at 0, the lot will be calculated from the percentage
FREE
The adviser finds the trend of the currency pair on a given number of bars, then determines the time of the onset of correction. If the trend is strong enough, and the correction becomes equal to the one specified in the parameters, then the adviser can open a trade in the direction of the trend, if additional indications of indicators confirm the opening of the trade. You can set different correction values and many other parameters. This version of the Expert Advisor is free, it has limitati
FREE

The indicator finds strong trend movements of a currency pair over the specified number of bars. It also finds correction to this trend. When the trend is strong enough, and the correction becomes equal to the values specified in the parameters, the indicator generates a signal. You can set different correction values, while the best suiting are 38, 50 and 62 (Fibonacci levels). In addition, you can configure the minimum length of trend, the number of history bars for search and other parameters
FREE
Advisor is an improved and enhanced version of ParabolicSarPro . It has a large number of adjustable parameters. Advisor Parameters:
Lots - lot size; Percentage of free money - percentage of free funds for opening each new transaction (works when Lots = 0); Slippage - slippage (maximum permissible price deviation in points); Magic - a unique identifier (it is necessary to do it differently, if several advisers are running in one terminal); MaxSpread - maximum spread for opening a trade (fo
The Expert Advisor places pending orders at the points of the Parabolic Sar indicator. After installation, it moves the order after the indicator. You can configure to open orders only BuyStop or only SellStop, if necessary. By default, pending orders are placed for both buy and sell. In addition to the Parapolic Sar indicator, this Expert Advisor uses other indicators for a more correct solution for opening a position. For example, it identifies divergences and convergences by different indicat
This is an adviser that often trades and opens trades almost every day (with normal optimization). In this case, the adviser opens no more than one transaction in each direction. When there are a lot of deals in optimization, more often it will give more profit in real life than advisers who, during optimization, make fewer deals, but show high profitability. This Expert Advisor is a free version of Trading every day and has some limitations: - currency pair only EURUSD - lot limit to 0.1 Input
FREE
If you need an adviser who often bargains and opens deals almost every day, you went to the address. Trading every day is intended for frequent trading for a long time. In this case, the adviser opens no more than one transaction in each direction. When there are a lot of deals in optimization, more often it will give more profit in real life than advisers who, during optimization, make fewer deals, but show high profitability.
This Expert Advisor is based on the indicators Williams Percent Ra
This Expert Advisor trades based on the Bollinger Bands indicator. It performs trades after a price rebound from the borderlines of the indicator. It is simple to use, contains only a few settings, which are easy to understand. This is the simplified version of the Master Bollinger Bands Expert Advisor. For better trading results, it is recommended to use the full version of the EA: https://www.mql5.com/en/market/product/21788 The free version does not provide the ability to use multiple indicat
FREE
The Expert Advisor is based on Williams` Percent Range. The EA trades both during low volatility and a trend if MACD is enabled. Two Williams` Percent Range indicators can be used to enter a trade with different parameters, while the third one can be configured to close a trade. Besides, the EA has the trailing stop and stop loss calculation functions depending on the currency pair movement strength.
Inputs Lots - lot size (if 0, the lot volume is calculated based on the % of account free marg
This adviser trades by volume, analyzing candles. It is a free version of Volume candlex master . Differences from the paid ones are that there are not some functions here: working on 2 timeframes, using Moving average, dynamic stop-loss and take-profit, and also the maximum lot is limited (no more than 0.10). Recommended timeframes: M5, M15, M30. Before trading, optimize the parameters of the advisor for your account. Input parameters Lots - lot size; MaxSpread - the maximum spread for the op
FREE
Volumes - one of the very important indicators of trade, since it is high volumes that move the market in one direction or another. This adviser trades by volume, analyzing candles. On this depends how strong the trend can begin. To improve the quality of transactions, uses many other indicators (Moving Average, RSI, ATR, ADX) and can determine the amount of take-profit and stop-loss, depending on the strength of the previous move. Recommended timeframes: M5, M15, M30. Before trading, optimize t

This trading adviser is designed for trading during a low volatility, when the majority of the population sleeps or rests. You can set up any trading hours (for example, from 23 pm to 9 am) and the closing hour of all open trades. Can make no more than 2 transactions in one direction, so that it is not critical for the deposit. To open trades uses the lines of the indicator Envelopes.
When testing and trading on the standard settings, be sure to optimize the trading time and transaction closin

This Expert Advisor identifies trend reversals based on fractals and some other indicators. It is a free lite version of Three fractals Brief description of the trading strategy: when the fractals were formed after a prolonged fall, and the last fractal did not update the minimum of the previous bar's lower fractal, then a trend reversal is determined (at the same time, there must be a fractal in the middle, which is higher than the others). Similarly, opposite for growth. In case other indicato
FREE
This utility is the improved version of Trailing stop for advisors. It manages other EAs' orders as well as the ones opened manually. It is capable of trailing the price (trailing stop function), set a stop loss and take profit if they have not been set before. The Pro version features the ability to set trailing stop based on fractals and points of Parabolic SAR. When configuring the utility for an EA having no trailing stop function, place it to the new window with the same currency pair speci
The utility manages other EAs' orders as well as the ones opened manually. It is capable of trailing the price (trailing stop function), set a stop loss and take profit if they have not been set before. When configuring the utility for an EA having no trailing stop function, place it to the new window with the same currency pair specifying the same Magic value (as for the EA orders the stop loss is to be applied to). You can set any timeframe. It does not affect the utility operation. Set Magic
FREE

This Expert Advisor operates based on fractals and trade volumes, as well as other indicators. It is a more advanced version of Three Fractals , as it is able to analyze the trade volumes and features dynamic placement of take profit and stop loss depending on the current trading activity. The trading strategy remains the same (based on formation of several fractals), but slightly improved, additional parameters have been added.
Input parameters Lots - lot size (if Lots=0, then the lot will be
This Expert Advisor identifies trend reversals based on fractals and some other indicators. If the fractals were formed after a prolonged fall, and the last fractal did not update the minimum of the previous bar's lower fractal, then a trend reversal is determined (at the same time, there must be a fractal in the middle, which is higher than the others). In case other indicators allow trading, a trade is performed (their settings can be customized for optimization).
Input parameters Lots - lot
This EA implements the EMA 8/18 strategy, which is used by many traders. Brief description of the strategy: The Buy is determined when the EMA 8 indicator crosses the EMA 18 from below, with the price moving more than 50 points from the crossing. The buy position is opened when the price touches the EMA for the first time, after that, as the price rises, the trade is maintained by a trailing stop with a step of 30-35 points. The opposite is for opening a sell position. The parameters of the fast
The Expert Advisor finds strong trend movements of a currency pair over the specified number of bars. It also finds correction to this trend (for the same period). When the trend is strong enough, and the correction becomes equal to the values specified in the EA parameters, the Expert Advisor opens the a trade in the trend direction. The advantage of this is that the EA will not buy at the trend maximum or sell at its minimum - trhe EA only trades after correction. However, you can set differen