Palantir
- Indicators
- Ivan Butko
- Version: 1.0
- Activations: 20
The indicator's operation is based on statistical calculation of historical trends. Palantir analyzes trends in history with the size specified in the settings, collects statistics and produces results based on them. For example, you set the trend size to 500 pips. The indicator analyzes trends whose corrections did not exceed 500 pips. Then it compares the latest (current) trend with historical ones and shows what place the current trend occupies in history. Indicator readings above 50% indicate that the current trend is larger than half of historical trends, and vice versa. In addition, the 50% level is the median, around which a trend reversal most often occurred. Readings of 70/80/90% and above also indicate high trend strength. The latest 300 historical trends are taken into account. The size of the predicted trend depends on the loaded history. For a trend that is too large (thousands of points), there may simply not be enough historical quotes. Therefore, if the indicator does not have enough history for calculation, it will notify you about this in the log. The optimal trend size is equal to the average daily price volatility. For example, for the EURUSD pair up to 120.0 points.
Carefully!
Values above the average may also indicate strong trends; in this case, the indicator readings may be high, but this will not reflect the real picture of the market. For example, if the indicator values are 95-99%, this does not mean that the price will immediately reverse. This means that the trend is rare, too strong and impulsive. The indicator only talks about actual statistics on history, but the market is not obliged to comply with these statistics.
Also pay attention to the rule for constructing a trend: until the trend has gone in the opposite direction for the number of points you specified, it continues accordingly. And, therefore, the reversal is counted from the new extremum and the target will also shift.
Panel
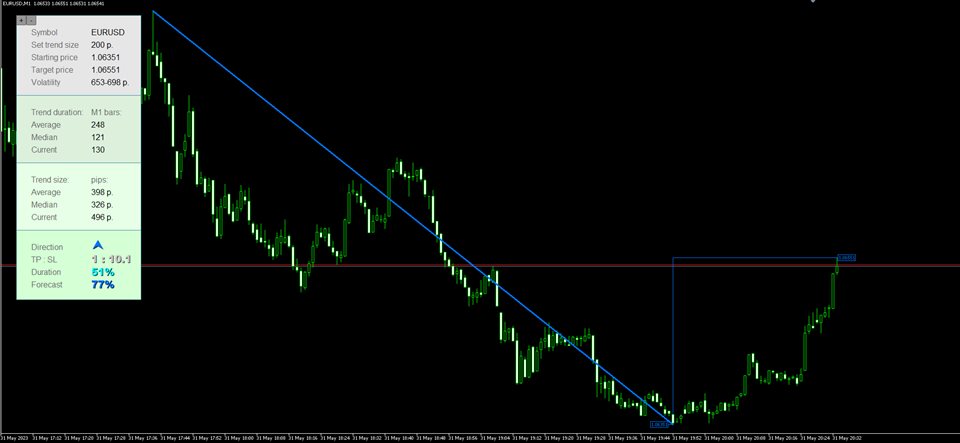
- Symbol – current financial instrument
- Set trend size – trend size set in settings
- Starting price – start price of the last calculated (current) trend
- Target price – the price level to which the price can reach with a calculated probability.
- Volatility – This is the average daily volatility of a financial instrument. Consists of two numbers: 1 – median volatility, 2 – average volatility.
- Average – this is an arithmetic indicator of the average duration of a trend, after which a reversal occurs by the number of points specified in the settings: the durations of all specified trends in history are calculated and divided by their number. Information for your information.
- Median – This is the duration of the trend at which a reversal most often occurs. For example, you set a trend of 500 pips. The indicator calculates and displays the median of 700 minutes (M1 bars). This means that for a given trend of 500 pips on history, it most often grew for 700 minutes, after which it reversed by a given 500 pips. An additional internal signal for a trend reversal.
- Current – current duration of the specified trend. Until the trend goes in the opposite direction for the number of points specified in the settings, the current trend will continue to grow.
- Average – this is an arithmetic indicator of the average size of a trend, after which a reversal occurs by the number of points specified in the settings: the sizes of all specified trends in history are calculated and divided by their number. Information for your information.
- Median – This is the size of the trend at which a reversal is most likely to occur. For example, you set a trend of 500 pips. The indicator calculates and displays the median of 800 pips. This means that for a given trend of 500 pips on history, it most often grew to 800 pips, after which it reversed by the given 500 pips. This is the main signal of the indicator. The general trading logic is based on this: wait for a favorable price and enter at the level of the expected reversal.
- Current – the current size of the specified trend. Until the trend goes in the opposite direction for the number of points specified in the settings, the current trend will continue to grow.
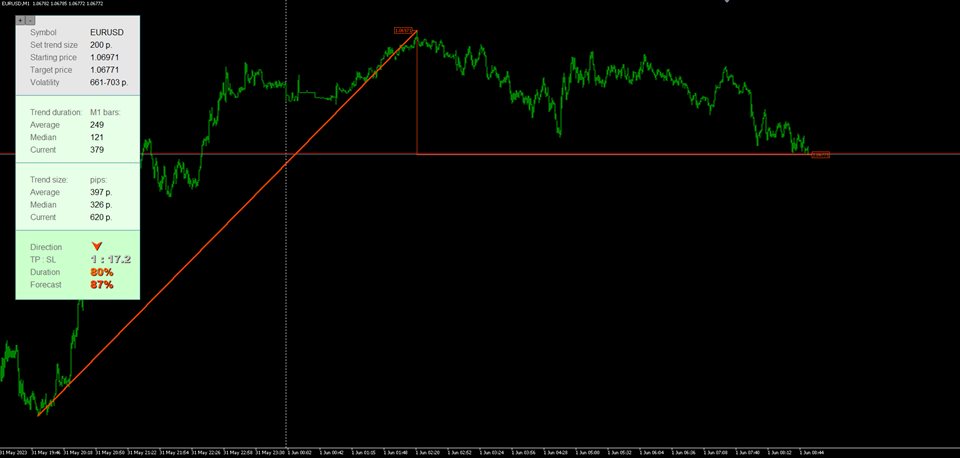
- TP : SL – the ratio of potential take profit to potential stop loss depending on the location of the current price relative to the nearest extremum in the direction of the current trend and the calculated price. The closer the price is to the extreme, the more profitable the price and vice versa.
- Direction – direction of a potential transaction. If the current trend is growing upward, then the direction of the transaction will be downward (we enter, expecting a reversal at the points we have specified), and vice versa.
- Duration – reversal forecast according to trend duration in minutes. Additional local signal indicator.
- Forecast – reversal forecast according to the trend size in points. The main signal of the indicator.
Additionally
The best signals are obtained on flat financial instruments, where the price most often moves within ranges. Palantir is an auxiliary indicator; it only serves as an additional signal in your trading strategy. You shouldn’t rely solely on it; use confirming signals. For those trading grid/averaging/martingale, Palantir can serve as a filter for entry. For example, you can open positions when the indicator reading is above 50%. Further, if a reversal did not occur and the previous trend continued to grow, then average at higher readings. You can zoom in or out of the window by clicking “+/-” in the upper left corner. Convenient for high resolutions. Each block is highlighted in color depending on the signal strength.
Recommendations
- Currency pair: any, but a less volatile one is better
- Timeframe: any on which it will be convenient for you to view the chart
- Strategy: any, where you find application. You can either average at values of 50% or more, or you can use it as an additional signal to your trading system
