ARKA Fisher Pro MT4
- Indicators
- Aren Davidian
- Version: 2.90
- Activations: 5
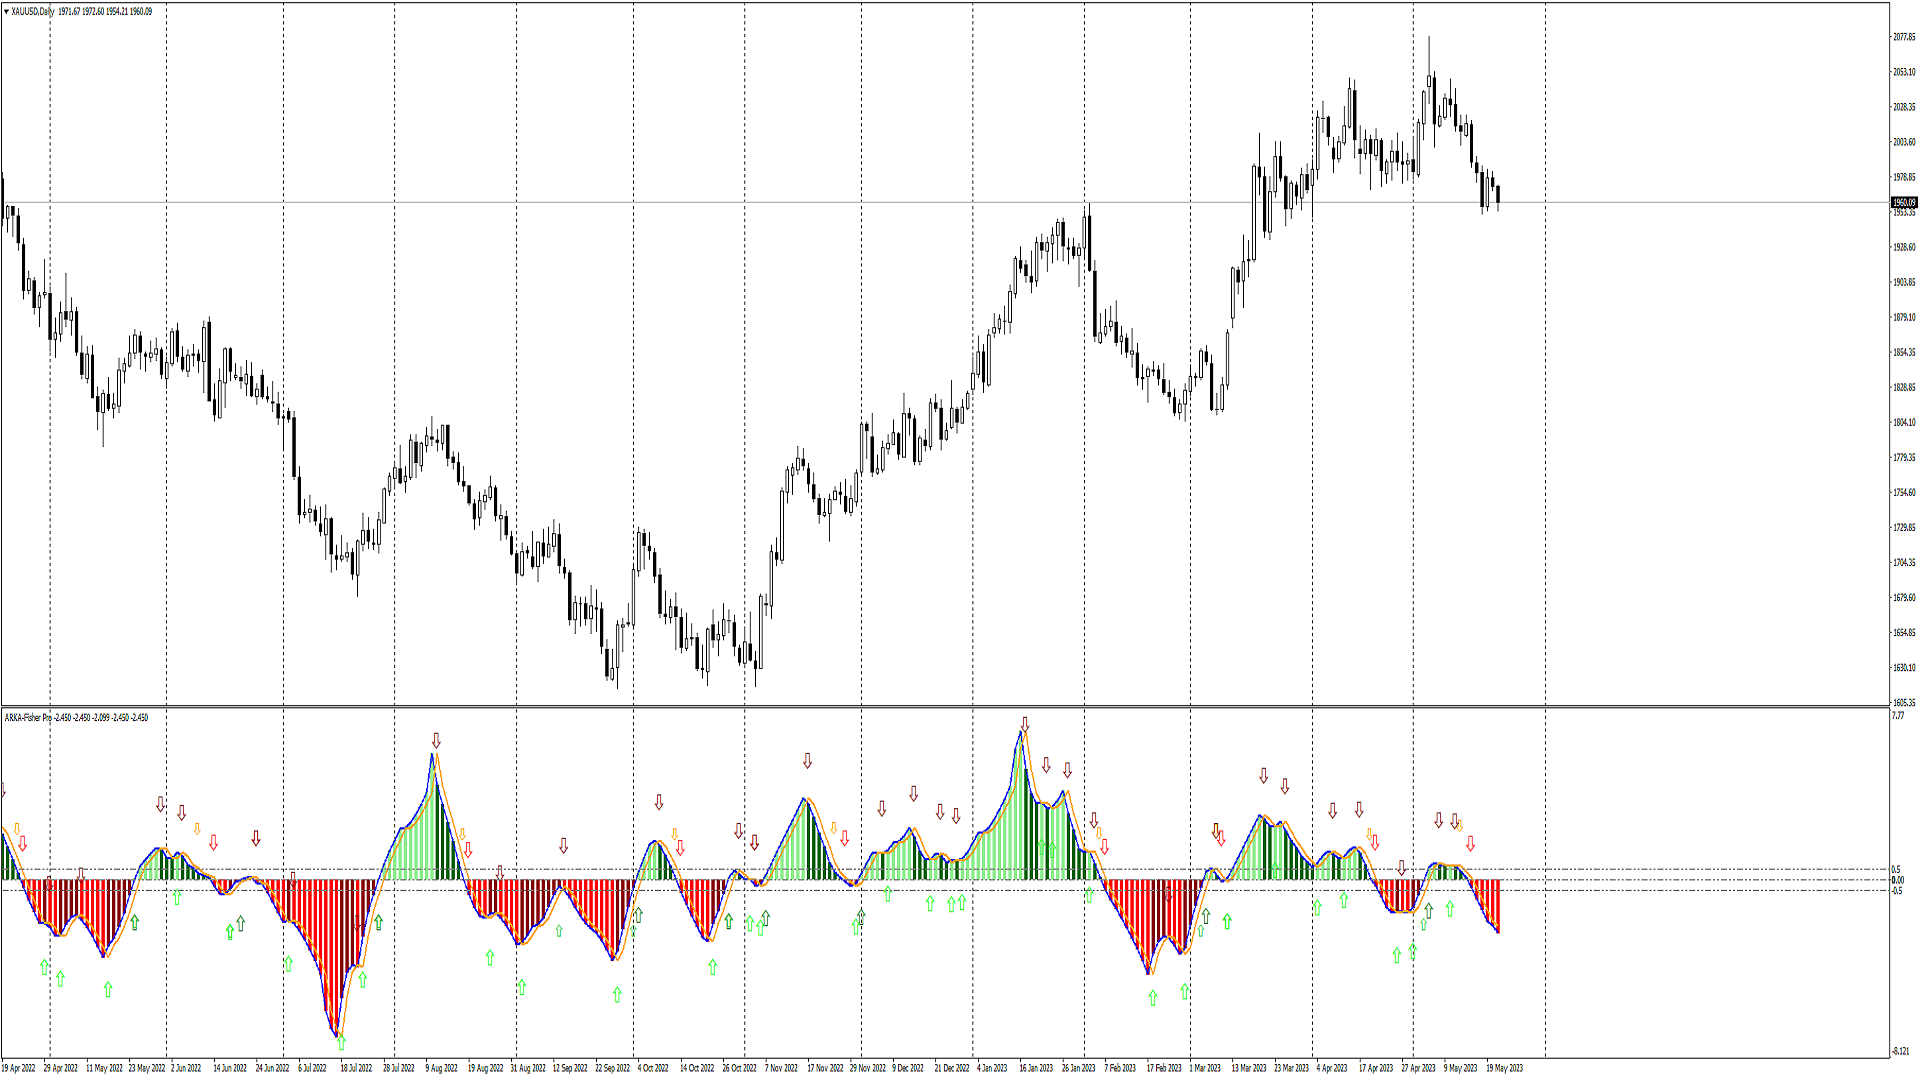
The Fisher Transform is a technical indicator created by John F. Ehlers that converts prices into a Gaussian normal distribution.
The indicator highlights when prices have moved to an extreme, based on recent prices. This may help in spotting turning points in the price of an asset. It also helps show the trend and isolate the price waves within a trend. The Fisher Transform is a technical indicator that normalizes asset prices, thus making turning points in price clearer.
Takeaways Turning points become a lot clearer with the use of Fisher Transform and its ability to track asset prices. In addition, while some traders choose to look for more dramatic readings that signal to price reversals, others may find it more beneficial to track Fisher Transform directional changes. Although the Fisher Transform is usually applied to asset prices, it can be applied to other indicators as well.
What to look for as mentioned in the Definition section, the Fisher Transform is a technical indicator that converts price to Gaussian normal distribution, often including data that is not usually normal distributed (i.e., market prices). This causes data to present itself as more uniform, with less extreme changes in order to determine true price reversals in the market.
This technical indicator is what some would call “unbounded,” and therefore it is possible for extremes to occur long-term. The basis of what constitutes an extreme is determined by the historical readings of the asset you are working with. Reading values differ depending on the asset you’re analyzing. Asset readings are important because they have the potential of signaling a reversal, which can be confirmed or denied by Fisher Transform directional changes.
The Fisher Transform will often have a signal line attached. It is essentially the Fisher Transform’s value moving average and moves slower than the traditional indicator’s line. It is often used when the Fisher Transform moves across the trigger line.
Many traders opt to use the Fisher Transform with other indicators that specifically map out trend analysis. This is because the Fisher Transform sends out many different trade signals, some of which are not profitable in the slightest. By pairing it up with other indicators, traders get a more complete picture on when to acknowledge and act on buy and sell signals.
Keep in mind that the Fisher Transform indicator should not be confused for Bollinger Bands. They may look different on a chart, but both are rooted in distribution of asset prices and can often be confused. One way to easily tell them apart is to remember that the Fisher Transform appears on a price chart as a separate indicator, whereas Bollinger Bands are distinctively overlaid over the price.
Limitations As mentioned in the What to look for section, the Fisher Transform can often send out many trade signals, causing a bit of congestion when all it is trying to do is make reversals and extreme change in price easier for traders to identify. This can become quite an issue, which is why pairing it with another indicator is highly suggested.
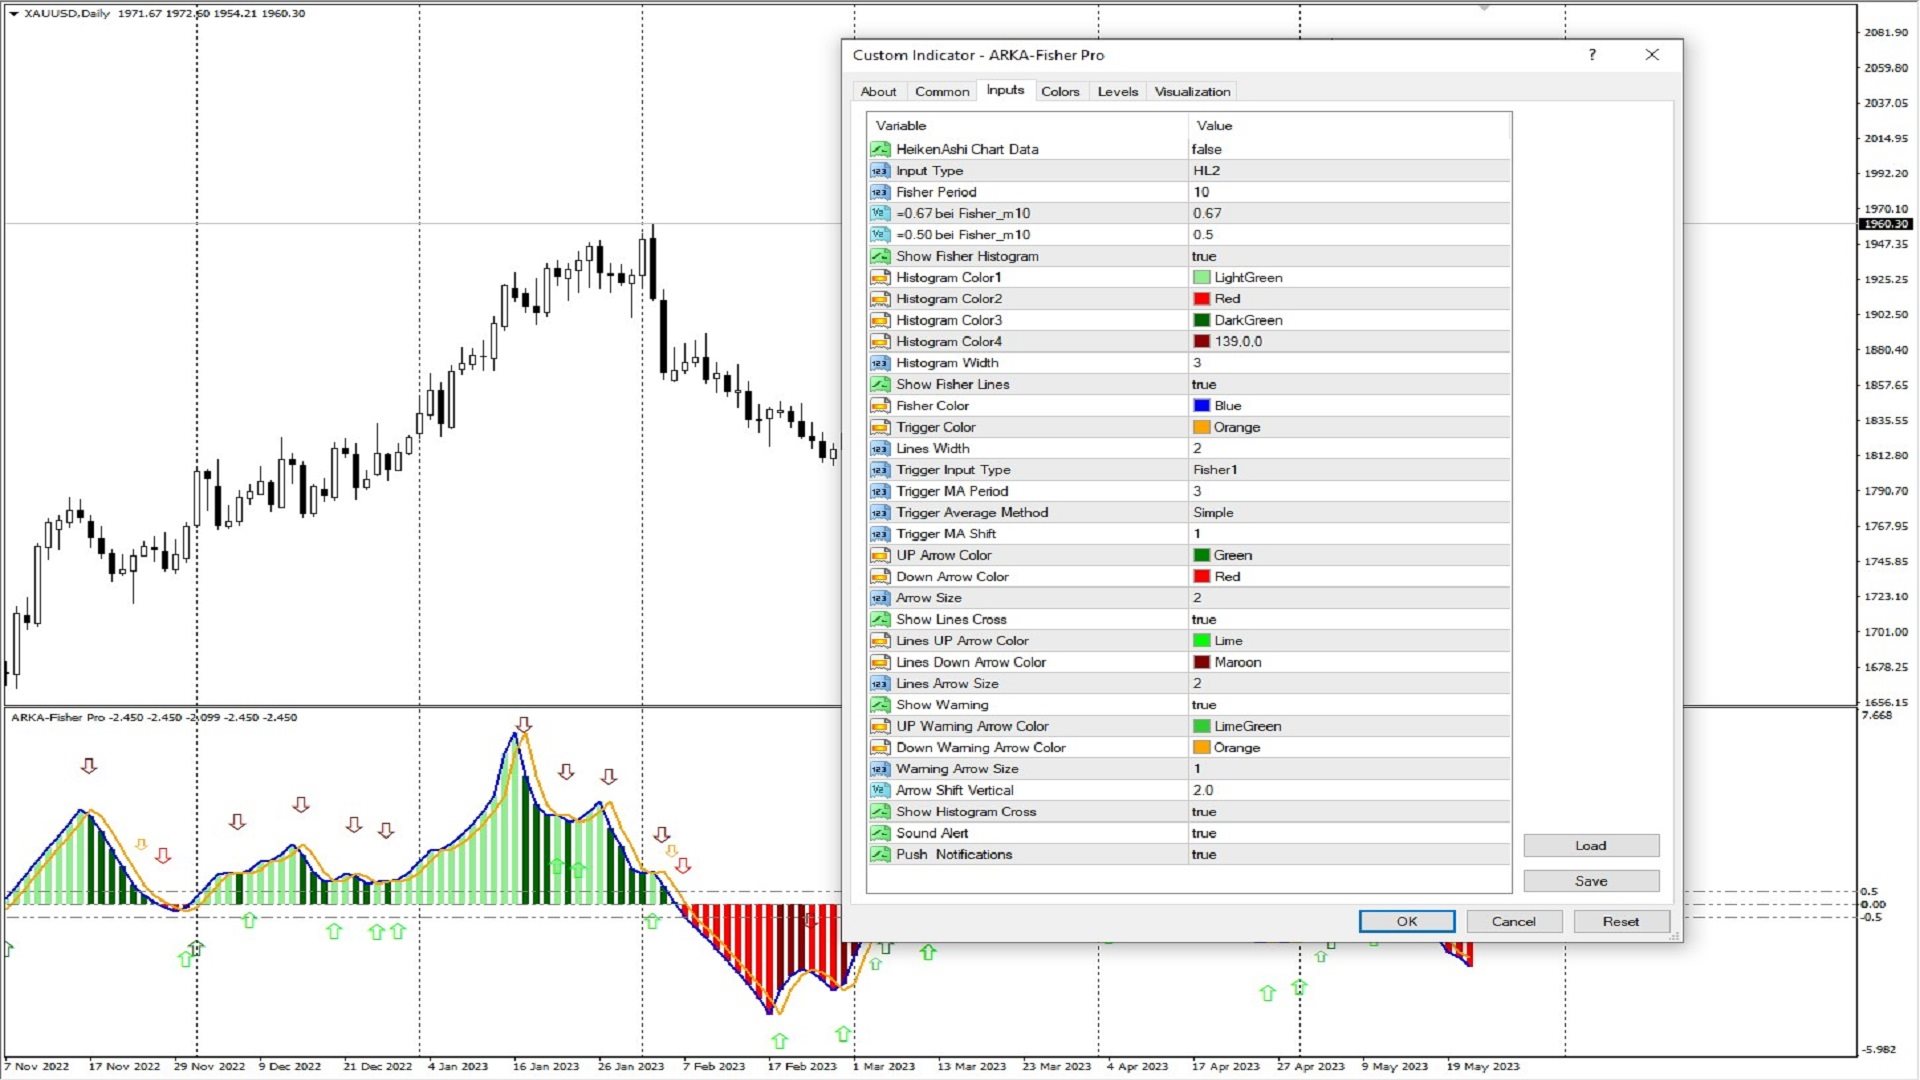
In this indicator, the histogram and lines can be used simultaneously and supports calculations based on Heiken Ashi data.
So far it is one with free version possibilities. Features of the Pro version include specifying signals with arrows and displaying notification alerts and more variety for calculation inputs.