ADX Analyzer Board Indicator
- Indicators
- Raul Canessa Castameda
- Version: 1.1
- Updated: 3 July 2023
- Activations: 5
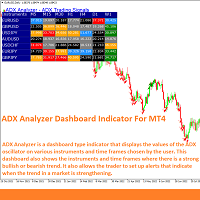
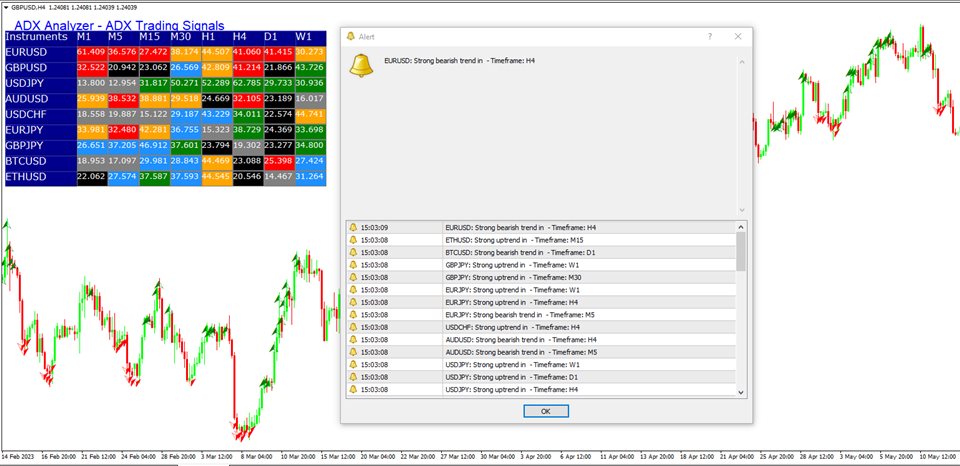
ADX Analyzer is a simple dashboard type indicator that displays the values of the ADX oscillator on multiple instruments and time frames chosen by the trader. The ADX is a trend strength indicator that is usually used in many trading strategies, especially in trend following systems, as a filter that indicates when the price has a strong bullish or bearish trend. This indicator and its dashboard can be configured to show signals when the ADX detects a strong bullish/bearish trend, when a strong trend is losing steam or markets where there is not a strong trend. The ADX Analyzer also displays alerts that tell the trader when a strong trend is beginning to develop in a given market. This tool is simple and easy to set up.
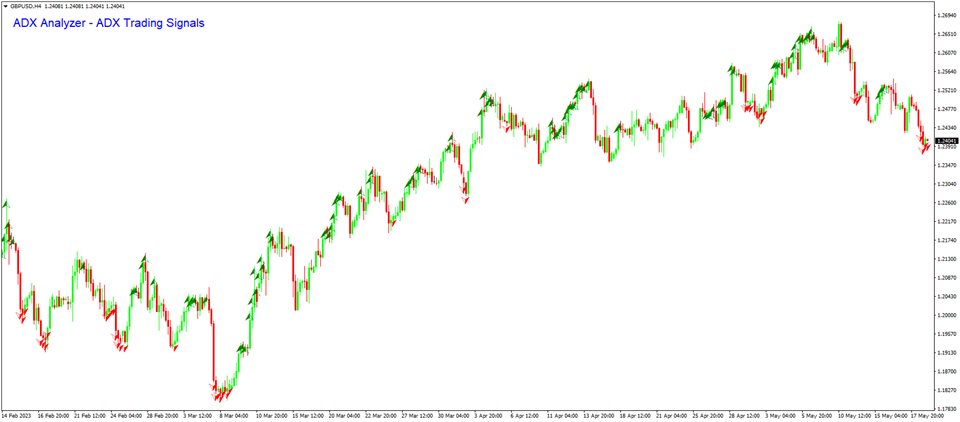
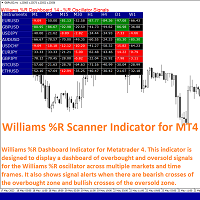
When the indicator is triggered, its signals are initially displayed as bullish green arrows or bearish red arrows above the price bars. These arrows indicate the periods in which there is a strong trend (ADX>25) either bullish (+DI>-DI) or bearish (-DI>+D+). If desired, the trader can view a dashboard with ADX signals in selected instruments and time frames. You can also trigger alerts that tell you which market is developing a strong trend.
By itself, this analysis tool should not be used as a trading system since ADX signals are not 100% reliable (any market trend can change at any time), as is the case with any technical indicator, but it is a useful support tool.
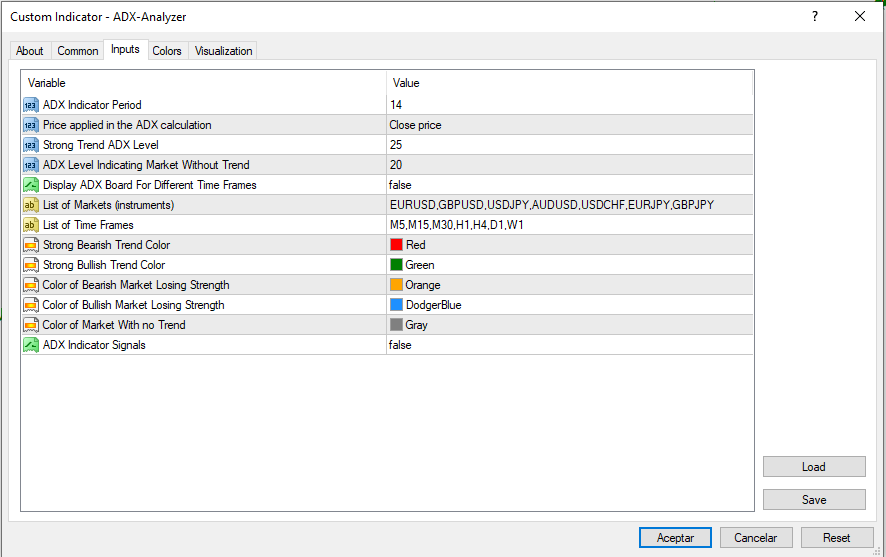
The parameters that can be configured in ADX Analyzer are the following:
- ADX Indicator Period: It is the value of the lookback period used to calculate the value of the ADX (Default value: 14).
- Price Applied in ADX Calculation: It is the price type used to calculate the ADX (Default value: Close Price).
- Strong Trend ADX Level: This is the ADX level above which the market trend is strong. (Default value: 25).
- ADX Level Indicating Market Without Trend: This is the ADX level below which the market trend is weak. (Default value: 20).
- Display ADX Board For Different Time Frames: Through this setting we indicate if we want the ADX Analyzer to show a dashboard of ADX values for different markets and time frames.
- List of Markets (Instruments): Here the trader indicates the markets or currency pairs in which he wishes to calculate the ADX values. You can add as many currency pairs and instruments offered by the broker on its platform. By default, the indicator shows EURUSD, GBPUSD, USDJPY, AUDUSD, USDCHF, EURJPY and GBPJPY pairs.
- List of Time Frames: In this parameter we can indicate in which time frames we want to calculate the ADX indicator and its signals for each currency pair. We can aggregate all the time frames that MT4 offers. By default, the indicator displays frames M5, M15, M30, H1, H4, D1 and W1.
- Strong Bearish Trend Color: Here we can change the color that indicates on the dashboard when there is a strong downtrend. (Default value: red)
- Strong Bullish Trend Color: Here we can change the color that indicates on the dashboard when there is a strong uptrend (Default value: green).
- Color of Bearish Market Losing Strenght: This parameter allows the trader to change the color that indicates on the dashboard when a strong downtrend is losing momentum (default value: orange).
- Color of Bullish Market Losing Strenght: This parameter allows the trader to change the color that indicates on the dashboard when a strong uptrend is losing momentum (default value: sky blue).
- ADX Indicator Signals: Through this last setting we can activate the ADX Analyzer alerts.
-To add new currency pairs in Markets, we write the symbol of the pair, for example XAUUSD, without the “/” symbol and separated by a comma (no spaces).
-Signals of changes in the trend strength are shown by changes in the color of the ADX boxes. When the ADX indicates a strong bearish trend the box turns red and when the market is in a strong bullish trend the box turns green.
