• Overview
  • Reviews
  • Comments
  • What's new

MACD Candles AM

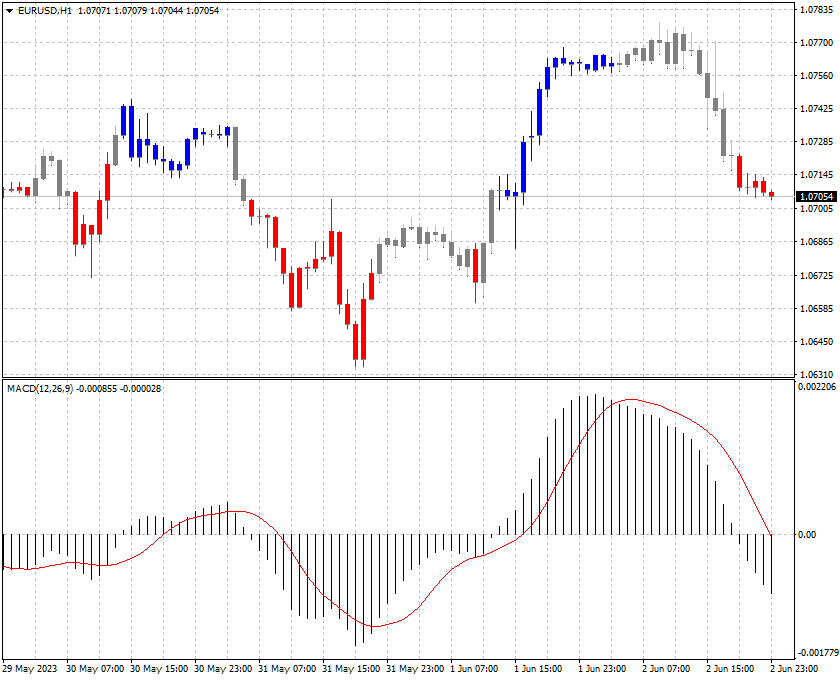
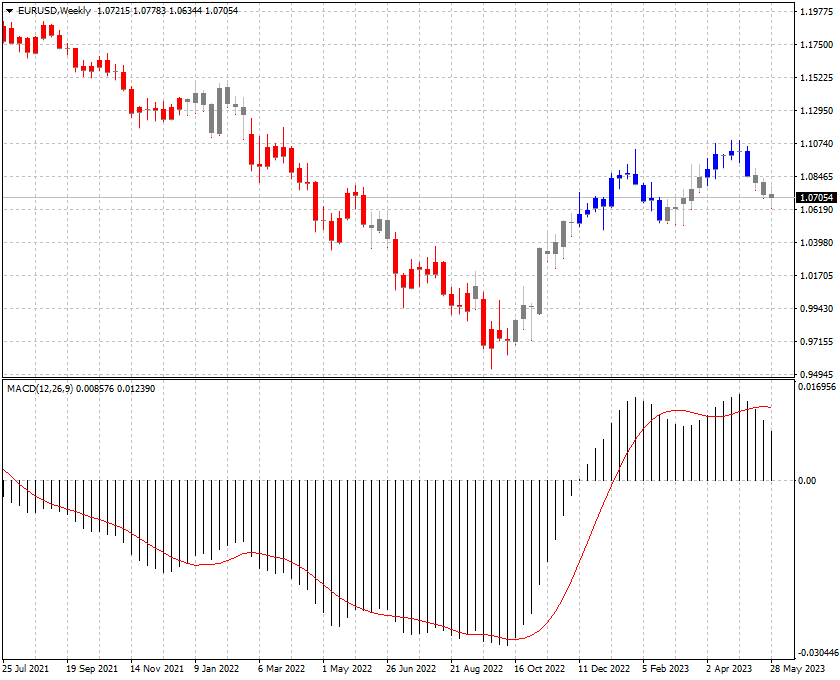
This indicator displays on the price chart (coloring candles graphics) signals about the standard MACD crossing the zero value, as well as about crossing the signal line.

The indicator does not redraw.


Custom Parameters:

  • Fast_EMA_Period - fast moving average period; 
  • Slow_EMA_Period - slow moving average period; 
  • Signal_Period - signal line period; 
  • MACD_Price - the price at which the indicator is built;


Recommended products
To get access to MT5 version please contact via private message. You can also check the other popular version of this indicator here . This is the exact conversion from TradingView:"Optimized Trend Tracker" by "kivancozbilgic" The screenshot shows similar results from tradingview and Metatrader when tested on ICMarkets on both platforms. This is a light-load processing indicator. It is a non-repaint indicator. Highlighting option is not available due to MT4 restricted graphics. Buffers are avai
The indicator detects and displays Shark harmonic pattern (see the screenshot). The pattern is plotted by the extreme values of the ZigZag indicator (included in the resources, no need to install). After detecting the pattern, the indicator notifies of that by a pop-up window, a mobile notification and an email. The indicator highlights the process of the pattern formation and not just the complete pattern. In the former case, it is displayed in the contour triangles. After the pattern is comple
To get access to MT5 version please click here . You can also check the other popular version of this indicator   here . This is the exact conversion from TradingView:"HIGH AND LOW Optimized Trend TrackerHL OTT" by "kivancozbilgic" The screenshot shows similar results from tradingview and Metatrader when tested on ICMarkets on both platforms. This is a light-load processing indicator. It is a non-repaint indicator. Colored Candle and Highlighting options are not available. Buffers are available
This indicator is designed to find the difference in MACD price and indicator.  This indicator shows the price and indicator difference on the screen. The user is alerted with the alert sending feature. Our Popular Products Super Oscillator HC Cross Signal Super Cross Trend Strong Trend Super Signal Parameters divergenceDepth -  Depth of 2nd ref. point search Fast ema -  Fast ema setting Slow ema - slow ema setting MACD sma - macd sma setting indAppliedPrice -  Applied price of indicator indMAM
MACDivergence MTF
Pavel Zamoshnikov
4.29 (7)
Advanced ideas of the popular MACD indicator: It detects and displays classic and reverse divergences (three methods of detecting divergences). It uses different color to highlight an uptrend and a downtrend. Two methods of determining a trend: а) MACD crosses the 0 level (classic signal); б) MACD crosses its own average (early signal). This is a multi-timeframe indicator: it can display MACD data from other timeframes. Two methods of drawing: classic histogram and line. It generates sound and v
The Trends Trg indicator determines the prevailing trend. They help to analyze the market at the selected time interval. Easy to set up and works on all pairs and all time frames. Trend indicators make it possible to classify the direction of price movement by determining its strength. Solving this problem helps investors enter the market on time and get a good return. It is extremely important for any trader to correctly determine the direction and strength of the trend movement. Unfortunatel
This product is a part of  ON Trade Waves Patterns Harmonic Elliot Wolfe you can test free version on EURJPY from this link  Wolf Waves Indicator Discover Wolf Waves - Your Ultimate Trading Tool! Are you on the hunt for a powerful tool to spot Wolf Waves easily on any time frame? Look no further! Our Wolf Waves indicator does the job effortlessly. Here's why it's perfect for you: Key Features: Automatic Detection: Our Wolf Waves indicator finds key points and draws lines on your chart automati
This indicator is an indicator for automatic wave analysis that is perfect for practical trading! Case... Note:   I am not used to the Western name for wave classification. Influenced by the naming habit of Chaos Theory (Chanzhongshuochan), I named the basic wave as   pen   , the secondary wave band as   segment   , and the segment with trend direction   as main trend segment   (this naming method will be used in future notes, let me tell you in advance), but the algorithm is not closely relat
TPM Cross (trend power moving cross) - is a trend following strategy based on custom signal points. Indicator consists from main custom moving chart line and trend power line. Indicator defines up and down movements by it's trend power and custom moving direction. When current market's trend looses it's power and opposite trend starts - power trend line  crosses moving and indicator plots an arrow.  Main indicator's adjustable inputs : movingPeriod - period of moving line  trendPeriod  - period
This indicator is based on the standard MACD indicator, but showing the changes up and down colored. It is a nice assistance to visualize our Expert MAGIC MACD. MAGIC MACD MT4: https://www.mql5.com/en/accounting/buy/market/41144?period=0 MAGIC MACD MT5: https://www.mql5.com/en/accounting/buy/market/41151?period=0 Inputs in the Indicator: Fast EMA: standard is 12 Slow EMA: standard is 26 Signal: depending on what you want to see. For the MAGIC MACD the standard is 1 in common settings: Fixed M
Introducing the Donchian Channels indicator for MQL4, a powerful technical analysis tool designed to boost your trading success. This indicator consists of four lines that represent the upper and lower boundaries of price movement over a specified period. With the Donchian Channels indicator, you can easily identify potential breakouts and reversals in the market. The upper line shows the highest high of the specified period, while the lower line represents the lowest low. The space between thes
Unlock the Power of Trend Dynamics with ATR Bands Midline Trend Indicator!   The   ATR Bands Midline Trend Indicator   is a meticulously crafted tool designed to help traders identify trends with precision using the Average True Range (ATR) as a foundation. This indicator focuses on calculating a midline derived from ATR bands, providing a unique perspective for traders to detect trend direction and strength effectively. ️   Important : This indicator is not optimized, leaving the door
Wise Men Indicator demo
Bohdan Kasyanenko
3 (2)
The indicator displays signals according to the strategy of Bill Williams on the chart. Demo version of the indicator has the same features as the paid, except that it can work only on a demo account . Signal "First Wise Man" is formed when there is a divergent bar with angulation.  Bullish divergent bar - with lower minimum and closing price in the upper half. Bearish divergent bar - higher maximum and the closing price at the bottom half. Angulation is formed when all three lines of Alligator
FREE
MACD TrendMA
Dmitriy Moshnin
The MACD TrendMA indicator is a trading system developed on the basis of the MACD indicator popular among many traders, and which is based on measuring the inclination (trend) angle of the moving averages, while measuring the ratio (convergence/divergence) between them. The signal for entering/exiting the market is the frame of the bars colors and color of the MACD TrendMA histogram according to the trend, which can be customized in the properties window of the indicator - in case the inclinatio
MACD Divergence MT4
KEENBASE SOFTWARE SOLUTIONS
KT MACD Divergence shows the regular and hidden divergences build between the price and oscillator. If your trading strategy anticipates the trend reversal, you can include the MACD regular divergence to speculate the potential turning points. And if your trading strategy based on the trend continuation, MACD hidden divergence would be a good fit. Limitations of KT MACD Divergence Using the macd divergence as a standalone entry signal can be a risky affair. Every divergence can't be interprete
This indicator is designed to find the difference in RSI price and indicator.  This indicator shows the price and indicator difference on the screen. The user is alerted with the alert sending feature. Our Popular Products Super Oscillator HC Cross Signal Super Cross Trend Strong Trend Super Signal Parameters divergenceDepth -   Depth of 2nd ref. point search RSI_Period -   Second calculation period indAppliedPrice -   Applied price of indicator indMAMethod -   MA calculation method findExtInte
Early WPR divergence - is the manual system to define trend reverse. Green histogram shows main trend, Orange one - shows "short"/local trend. System is looking for clear divergence between both trends and pick up position(plot buy/sell arrows). When main trend is up, but local trend reverses to bearish trend and get's big power - sell arrow is plotted;    When main trend is down, but local trend reverses to bullish trend and get's big power - buy arrow is plotted;  Main inputs are : mediumTrend
UPD1 Rsi Dots Dashboard
Vitaliy Kuznetsov
5 (1)
The indicator shows signals based on the terminal RSI oscillator on the chart. It is possible to filter out repeated signals. Here the oscillator is used to search for a reverse signal. It is recommended as an entry point in swing strategies and trading from levels. A multi-currency dashboard is available. With it, you can easily switch between charts. In product discussions, you can suggest an algorithm in which you can embed a dashboard. Input parameters. Main Settings. Bars Count – the n
FREE
Super trend is one of the best trend indicators in metatrader 4 (MT4). Triple SuperTrend indicator is an indicator that consist of three super trend indicator that can be aranged. This indicator is built by mql4 language and doesn't provided by MT4 platform. Highly recommended using EMA SuperTrend Strategy Indicator if you want to get better result in here: https://www.mql5.com/en/market/product/91664 This indicator is easy to use, power full and has many benefits, there are: Using three indic
FREE
The Supertrend indicator available on the MQL5 Market for MetaTrader 4 is an exceptional tool for traders seeking to identify prevailing trends in specific trading instruments. This indicator boasts two built-in indicators, Average True Range and Standard Deviation, allowing traders to choose the most suitable indicator based on their preferred trading strategy. Additionally, users can customize the period of these indicators and select the price (Close, High, Low, Open, Weighted) to which it s
The indicator shows the Buy/Sell direction. The calculations use the opening prices and their rate of change for the billing period - "Calculation period" MTF indicator - "Calculation timeframe", no repaint - NRP. Two display types: "Chart default" или "Chart color" For "Chart color" color customization available : "Bar color" Two types stop levels: "Simple stop level" or "Dynamic stop level " Color settings: "Stop level color" Alerts available: "Chart message", "Push message", "Email message" F
Introducing the Austin Trend Scanner: Your Ultimate Tool for Timely Trend Identification. The Austin Trend Scanner is a groundbreaking MetaTrader 4 indicator meticulously engineered to provide traders with precise trend reversal signals across multiple timeframes. Built upon advanced algorithms and non-repainting technology, this indicator offers unparalleled accuracy in identifying profitable trading opportunities. Key Features: 1. Non-Repainting Signals: The Austin Trend Scanner delivers non
The Cross Period Moving Average Support Resistant Map puts multiple latest updated MA value in the same window. Useful for trend and breakout traders to identify support and resistance at a glance. Highlighted with multiple line width for each period. MA type : SMA MA price : candle close price MA periods: H1 , H4 , D1 , W1 , MN **if you have any enquiry, contact me at : pipsstalker1507@gmail.com
To access the TD sequential Scanner for MT5, please check https://www.mql5.com/en/market/product/123369?source=Site +Market+My+Products+Page. One of the MT5 versions includes additional timeframes such as M1, M2, M3,H2,H6,H8 and so on.( https://www.mql5.com/en/market/product/123367?source=Site +Market+My+Products+Page) TD Sequential Scanner: An Overview The TD Sequential scanner is a powerful technical analysis tool designed to identify potential price exhaustion points and trend reversals in fi
KT Stoch Divergence MT4
KEENBASE SOFTWARE SOLUTIONS
Divergence is one of the vital signals that depicts the upcoming price reversal in the market. KT Stoch Divergence shows the regular and hidden divergences build between the price and stochastic oscillator. Limitations of KT Stoch Divergence Using the Stochastic divergence as a standalone entry signal can be risky. Every divergence can't be interpreted as a strong reversal signal. For better results, try to combine it with price action and trend direction. Features Marks regular and hidden di
Introducing the Consecutive Green/Red Candle Alert Indicator for MT4 - Your Trend Spotting Companion! Are you ready to take your trading to the next level? We present the Consecutive Green/Red Candle Alert Indicator, a powerful tool designed to help you spot trends and potential reversals with ease. Whether you're a new trader looking for clarity in the market or an experienced pro seeking additional confirmation, this indicator is your trusted companion. Key Features of the Consecutive Green/Re
FREE
KT Knoxville Divergence MT4
KEENBASE SOFTWARE SOLUTIONS
5 (1)
The KT Knoxville Divergence is a powerful tool that reveals unique price divergences in a financial instrument by employing a carefully crafted combination of the Relative Strength Index (RSI) and a momentum oscillator. This indicator effectively captures subtle variations in market dynamics and assists traders in identifying potentially profitable trading opportunities with greater precision. Knoxville Divergences is a type of divergence in trading developed by Rob Booker. Divergence in tradin
Auto Fibo Retracement MT4
Nguyen Tuan Son
3.67 (3)
Just another Auto Fibonacci Retracement indicator . However, this is the most Flexible & Reliable one you can find for FREE. If you use this indicator and you like it, please leave a review/comment. If you just looking for a powerful indicator, please check this   Timeframes Trend Scanner indicator ### FEATURES ### Auto-calculate up to 7 Fibonacci levels on your customized frame. Adjust levels as your need. Use   High/Low price or  Open/Close price to calculate. Freeze the levels and don't recal
FREE
MACDXover
Muhammad Robith
This indicator helps you to find price that may cause MACD Signal crossover on the current bar.. These crossover points are depicted in form of stars (like Parabolic SAR). prevEMA line also helps you to decide the trend. Get 20% OFF for rents for 1 year! How to use: MACDSignalStars (Violet) stars displayed are the the prices that make the MACDmain = MACDsignal. If the close price is higher than the star, then MACDmain > MACD signal. If the close price is lower than the star, then MACDmain < MA
Version Voles Indicator without the inputs and the balance line. Operation Principles It is based on the standard indicators of the MetaTrader 4 terminal. It shows the market entry points. How to trade When a bar is complete and an arrow is shown, place a BuyStop order at the High of the bar if the arrow is green, or a SellStop order at the Low of the bar if the arrow is red. StopLoss should be set at the level of the last downwards fractal below the entry point at a green arrow or at the leve
Buyers of this product also purchase
Gann Made Easy
Oleg Rodin
4.79 (109)
Gann Made Easy is a professional and easy to use Forex trading system which is based on the best principles of trading using the theory of W.D. Gann. The indicator provides accurate BUY and SELL signals including Stop Loss and Take Profit levels. You can trade even on the go using PUSH notifications. PLEASE CONTACT ME AFTER PURCHASE TO GET MY TRADING TIPS PLUS A GREAT BONUS! Probably you already heard about the Gann trading methods before. Usually the Gann theory is a very complex thing not only
Dynamic Forex28 Navigator
Bernhard Schweigert
5 (4)
Specials Discount now. The Next Generation Forex Trading Tool. Dynamic Forex28 Navigator is the evolution of our long-time, popular indicators, combining the power of three into one: Advanced Currency Strength28 Indicator (695 reviews) + Advanced Currency IMPULSE with ALERT (520 reviews) + CS28 Combo Signals (recent Bonus) Details about the indicator  https://www.mql5.com/en/blogs/post/758844 What Does The Next-Generation Strength Indicator Offer? Everything you loved about the originals, now
-   Real price is 80$   - 40% Discount ( It is 49$ now ) - Lifetime update free Contact me for instruction, add group and any questions! Related Products:  Bitcoin Expert , Gold Expert - Non-repaint - I just sell my products in Elif Kaya profile, any other websites are stolen old versions, So no any new updates or support. Introduction The breakout and retest strategy is traded support and resistance levels. it involves price breaking through a previous level.  The break and retest strategy is
Scalper Inside PRO
Alexey Minkov
4.75 (61)
!SPECIAL SALE!  An exclusive indicator that utilizes an innovative algorithm to swiftly and accurately determine the market trend. The indicator automatically calculates opening, closing, and profit levels, providing detailed trading statistics. With these features, you can choose the most appropriate trading instrument for the current market conditions. Additionally, you can easily integrate your own arrow indicators into Scalper Inside Pro to quickly evaluate their statistics and profitability
FX Levels MT4
Daniel Stein
5 (2)
FX Levels: Exceptionally Accurate Support & Resistance for All Markets Quick Overview Looking for a reliable way to pinpoint support and resistance levels across any market—currencies, indices, stocks, or commodities? FX Levels merges our traditional “Lighthouse” method with a forward-thinking dynamic approach, offering near-universal accuracy. By drawing from real-world broker experience and automated daily plus real-time updates, FX Levels helps you identify reversal points, set profit targe
FX Volume
Daniel Stein
4.59 (34)
FX Volume: Experience Genuine Market Sentiment from a Broker’s Perspective Quick Overview Looking to elevate your trading approach? FX Volume provides real-time insights into how retail traders and brokers are positioned—long before delayed reports like the COT. Whether you’re aiming for consistent gains or simply want a deeper edge in the markets, FX Volume helps you spot major imbalances, confirm breakouts, and refine your risk management. Get started now and see how genuine volume data can
IX Power MT4
Daniel Stein
4.67 (6)
IX Power: Unlock Market Insights for Indices, Commodities, Cryptos, and Forex Overview IX Power is a versatile tool designed to analyze the strength of indices, commodities, cryptocurrencies, and forex symbols. While FX Power offers the highest precision for forex pairs by leveraging all available currency pair data, IX Power focuses exclusively on the underlying symbol’s market data. This makes IX Power an excellent choice for non-forex markets and a reliable option for forex charts when deta
FX Power MT4 NG
Daniel Stein
4.94 (18)
FX Power: Analyze Currency Strength for Smarter Trading Decisions Overview FX Power is your go-to tool for understanding the real strength of currencies and Gold in any market condition. By identifying strong currencies to buy and weak ones to sell, FX Power simplifies trading decisions and uncovers high-probability opportunities. Whether you’re looking to follow trends or anticipate reversals using extreme delta values, this tool adapts seamlessly to your trading style. Don’t just trade—trade
Advanced Supply Demand
Bernhard Schweigert
4.91 (294)
CURRENTLY 26% OFF !! Best Solution for any Newbie or Expert Trader! This indicator is a unique, high quality and affordable trading tool because we have incorporated a number of proprietary features and a new formula. With this update, you will be able to show double timeframe zones. You will not only be able to show a higher TF but to show both, the chart TF, PLUS the higher TF: SHOWING NESTED ZONES. All Supply Demand traders will love it. :) Important Information Revealed Maximize the potentia
Scalper Vault
Oleg Rodin
5 (28)
Scalper Vault is a professional scalping system which provides you with everything you need for successful scalping. This indicator is a complete trading system which can be used by forex and binary options traders. The recommended time frame is M5. The system provides you with accurate arrow signals in the direction of the trend. It also provides you with top and bottom signals and Gann market levels. The indicator provides all types of alerts including PUSH notifications. PLEASE CONTACT ME AFT
Chart Patterns All in One
Davit Beridze
4.68 (19)
Try "Chart Patterns All in One" Demo and get Bonus. Send me message after trying demo to get Bonus. Leave a Comment after purchase to get 8 high quality indicators as Bonus. The Chart Patterns All-in-One indicator helps traders visualize various chart patterns commonly used in technical analysis. It supports identifying potential market behaviors, but profitability is not guaranteed. Testing in demo mode is recommended before purchasing. Current Offer : 50% discount on the "Chart Patterns All
Currency Strength Exotics
Bernhard Schweigert
4.87 (31)
CURRENTLY 20% OFF ! Best Solution for any Newbie or Expert Trader! This Indicator is specialized to show currency strength for any symbols like Exotic Pairs Commodities, Indexes or Futures. Is first of its kind, any symbol can be added to the 9th line to show true currency strength of Gold, Silver, Oil, DAX, US30, MXN, TRY, CNH etc. This is a unique, high quality and affordable trading tool because we have incorporated a number of proprietary features and a new formula. Imagine how your trading
Easy Breakout
Mohamed Hassan
5 (9)
After your purchase, feel free to contact me for more details on how to receive a bonus indicator called VFI, which pairs perfectly with Easy Breakout for enhanced confluence!   Easy Breakout is a powerful price action trading system built on one of the most popular and widely trusted strategies among traders: the Breakout strategy ! This indicator delivers crystal-clear Buy and Sell signals based on breakouts from key support and resistance zones. Unlike typical breakout indicators, it levera
Gold Venamax MT4
Sergei Linskii
5 (1)
Gold Venamax - this is a best stock technical indicator. The indicator algorithm analyzes the price movement of an asset and reflects volatility and potential entry zones.   Indicator features: This is a super indicator with Magic and two Blocks of trend arrows for comfortable and profitable trading. Red Button for switching blocks is displayed on the chart. Magic is set in the indicator settings, so that you can install the indicator on two charts displaying different Blocks. Gold Venamax can b
Golden Trend Indicator
Noha Mohamed Fathy Younes Badr
4.9 (10)
Golden Trend indicator  is The best indicator for predicting trend movement this indicator never lags and never repaints and never back paints    and give  arrow buy and sell    before the candle appear  and it will help you and  will make your trading decisions clearer its work on all currencies and  gold and crypto and all time frame This unique  indicator uses very secret algorithms to catch the  trends, so you can trade using this indicator and see the trend clear on charts  manual guide and
Trend Screener
STE S.S.COMPANY
4.78 (93)
Unlock the Power of Trends Trading with the Trend Screener Indicator: Your Ultimate Trend Trading Solution powered by Fuzzy Logic and Multi-Currencies System! Elevate your trading game with the Trend Screener, the revolutionary trend indicator designed to transform your Metatrader into a powerful Trend Analyzer. This comprehensive tool leverages fuzzy logic and integrates over 13 premium features and three trading strategies, offering unmatched precision and versatility. LIMITED TIME OFFER : Sup
First of all Its worth emphasizing here that this Trading Tool is Non-Repainting Non-Redrawing and Non-Lagging Indicator Which makes it ideal for professional trading . Online course, user manual and demo. The Smart Price Action Concepts Indicator is a very powerful tool for both new and experienced traders . It packs more than 20 useful indicators into one combining advanced trading ideas like Inner Circle Trader Analysis and Smart Money Concepts Trading Strategies . This indicator focuses on
Gold Stuff
Vasiliy Strukov
4.86 (249)
Gold Stuff is a trend indicator designed specifically for gold and can also be used on any financial instrument. The indicator does not redraw and does not lag. Recommended time frame H1. At it indicator work full auto  Expert Advisor EA Gold Stuff. You can find it at my profile. Contact me immediately after the purchase to get   personal bonus!  You can get a free copy of our Strong Support and Trend Scanner indicator, please pm. me! Settings  and manual here  Please note that I do not sell my
TPSpro RFI Levels
Roman Podpora
4.85 (27)
A key element in trading is zones or levels from which decisions to buy or sell a trading instrument are made. Despite attempts by major players to conceal their presence in the market, they inevitably leave traces. Our task was to learn how to identify these traces and interpret them correctly. ИНСТРУКЦИЯ RUS         INSTRUCTIONS  ENG            R ecommended to use with an indicator   -   TPSpro  TREND PRO -  Version MT5 Bonus: 6 months of "RFI SIGNALS" subscription with your purchase! Main
Bull versus Bear
Mohamed Hassan
4.5 (18)
Send us a message after your purchase to receive more information on how to get your  BONUS  for FREE  that works in great combination with Bull vs Bear ! Bull versus Bear is an easy-to-use Forex indicator that gives traders clear and accurate signals based on clear trend retests . Forget about lagging indicators or staring at charts for hours because  Bull vs Bear provides real-time entries with no lag and no repaint, so you can trade with confidence. Bull vs Bear  helps you enter trades durin
Beast Super Signal
Dustin Vlok
4.73 (89)
Limited Special now on!  GET 28% OFF! Was $249, now only $179!  The Beast Super Signal indicator is a straightforward, trend-based indicator that's easy to use. It continuously monitors current market conditions, looking for new trends or opportunities to join existing ones. When all of its internal strategies align perfectly, the indicator provides a buy or sell signal. Just act on the signal arrow alert; no additional confirmation is needed. This versatile trading tool works across all curre
CURRENTLY 31% OFF !! Best Solution for any Newbie or Expert Trader! This indicator is a unique, high quality and affordable trading tool because we have incorporated a number of proprietary features and a secret formula. With only ONE chart it gives Alerts for all 28 currency pairs. Imagine how your trading will improve because you are able to pinpoint the exact trigger point of a new trend or scalping opportunity! Built on new underlying algorithms it makes it even easier to identify and confir
Special offer : ALL TOOLS , just $35 each! New tools   will be   $30   for the   first week   or the   first 3 purchases !  Trading Tools Channel on MQL5 : Join my MQL5 channel to update the latest news from me Unlock the power of ICT’s Inversion Fair Value Gap (IFVG) concept with the Inversion Fair Value Gaps Indicator ! This cutting-edge tool takes Fair Value Gaps (FVGs) to the next level by identifying and displaying Inverted FVG zones—key areas of support and resistance formed after price m
PZ Harmonacci Patterns
PZ TRADING SLU
3.17 (6)
Trade smarter, not harder: Empower your trading with Harmonacci Patterns Special Offer: Purchase now to receive free bonuses worth $165! (Read more for details) This is arguably the most complete harmonic price formation auto-recognition indicator you can find for the MetaTrader Platform. It detects 19 different patterns, takes fibonacci projections as seriously as you do, displays the Potential Reversal Zone (PRZ) and finds suitable stop-loss and take-profit levels. [ Installation Guide | Upda
Special offer : ALL TOOLS , just $35 each! New tools   will be   $30   for the   first week   or the   first 3 purchases !  Trading Tools Channel on MQL5 : Join my MQL5 channel to update the latest news from me Introducing the revolutionary RSI Kernel Optimized with Scanner , a cutting-edge tool that redefines traditional RSI analysis by integrating the powerful Kernel Density Estimation (KDE) algorithm. This advanced indicator not only provides real-time insights into market trends but also in
System Trend Pro
Aleksandr Makarov
5 (2)
System Trend Pro - This is the best trend trading indicator!!! You can get this indicator for free -  Quantum Entry PRO The indicator no repaint!!!   The indicator has   MTF   mode, which adds confidence to trading on the trend (   no repaint   ). How to trade? Everything is very simple, we wait for the first signal (big arrow), then wait for the second signal (small arrow) and enter the market in the direction of the arrow. (See screens 1 and 2.) Exit on the opposite signal or take 20-30 pips
Legacy of Gann
Pavel Zamoshnikov
4.83 (12)
The indicator very accurately determines the levels of the possible end of the trend and profit fixing. The method of determining levels is based on the ideas of W.D.Gann, using an algorithm developed by his follower Kirill Borovsky. Extremely high reliability of reaching levels (according to K. Borovsky  - 80-90%) Indispensable for any trading strategy – every trader needs to determine the exit point from the market! Precisely determines targets on any timeframes and any instruments (forex, met
Automated Trendlines
Georgios Kalomoiropoulos
5 (16)
Trendlines  are the most essential tool of technical analysis in forex trading.  Unfortunately, most  traders don’t draw them correctly. Automated Trendlines indicator is a professional tool for serious traders that help you visualize the trending movement of the markets . There are two types of Trendlines Bullish Trendlines and Bearish Trendlines. In the uptrend, Forex trend line is drawn through the lowest swing-points of the price move. Connecting at least two "lowest lows" will create a tr
CURRENTLY 26% OFF Best Solution for any Newbie or Expert Trader! This Indicator is a unique, high quality and affordable trading tool because we have incorporated a number of proprietary features and a new formula. With only ONE chart you can read Currency Strength for 28 Forex pairs! Imagine how your trading will improve because you are able to pinpoint the exact trigger point of a new trend or scalping opportunity? User manual: click here That's the first one, the original! Don't buy a worthle
TPSproTREND PrO
Roman Podpora
4.71 (28)
TPSpro TRENDPRO  - is a trend indicator that automatically analyzes the market and provides information about the trend and each of its changes, as well as giving signals for entering trades without redrawing! The indicator uses each candle, analyzing them separately. referring to different impulses - up or down impulse. Exact entry points into transactions for currencies, crypto, metals, stocks, indices!  ИНСТРУКЦИЯ RUS         INSTRUCTIONS  ENG              R ecommended to use with an indicato
More from author
TTF Candles AM
Andriy Matviyevs'kyy
This indicator displays the moment when the TTF oscillator crosses the zero value, and the moment when the TTF oscillator crosses its smoothed value. Crossing the zero value by the TTF oscillator is a buy/sell signal. If the TTF oscillator crosses its smoothed value, it is a signal of a trend change. The signal is given after the end of the formation of the candle. The signal is confirmed when the price crosses the high/low of the bar on which the signal was given. The indicator does not redraw.
TTF Osc AM
Andriy Matviyevs'kyy
This indicator displays the moment when the TTF oscillator crosses the zero value, and the moment when the TTF oscillator crosses its smoothed value. Crossing the zero value by the TTF oscillator is a buy/sell signal. If the TTF oscillator crosses its smoothed value, it is a signal of a trend change. The signal is given after the end of the formation of the candle. The signal is confirmed when the price crosses the high/low of the bar on which the signal was given. The indicator does not redraw.
Zone Trade AM
Andriy Matviyevs'kyy
The indicator is based on the elements of Bill Williams' trading system. Sell signals are formed when MACD and OsMA values are falling simultaneously (Bill Williams calls these indicators АО and АС in his book), while buy signals appear when both indicators are rising. Thick and thin colored histograms match MACD and OsMA values. If the histogram is greater than 0, the indicator value is rising. Otherwise, it is falling. Positions should be opened when the price exceeds the bar's high or low, at
ADX Trigger AM
Andriy Matviyevs'kyy
The indicator is an interpretation of the Average Directional Movement Index (ADX) allowing you to determine if there is a price trend. It was developed by Welles Wilder and described in his book "New concepts in technical trading systems". The indicator determines entry points and uses crossing of ADX +/- lines and growth or fall of the main ADX line. When the indicator crosses the zero line, the trend is changed. If the oscillator's value is 1 - the price grows, the trend remains; If the oscil
BarLineBreak AM
Andriy Matviyevs'kyy
The indicator detects the current trend using the following definition: A trend is a market situation when each subsequent peak is higher/lower than the previous one, as well as each subsequent bottom is higher/lower than the previous one. Exceeding all previous peaks/bottoms on the specified amount of bars by the current peak/bottom is considered to be a beginning of a new trend. The indicator paints bars according to an identified trend. The indicator does not repaint. Settings: Lines_Break
RSI Signal AM
Andriy Matviyevs'kyy
This indicator displays the signals based on the values of the classic RSI indicator on the price chart. The RSI can be used for determining the overbought or oversold areas on the chart. Reaching these levels means that the market can soon turn around, but it does not give signal, as in a strong trend the market can stay in the overbought or oversold state for quite a long time. As with most oscillators, the signals are generated when leaving these areas. This indicator allows to display three
WPR Signal AM
Andriy Matviyevs'kyy
This indicator displays the signals based on the values of the classic WPR indicator. The WPR indicator can be used for determining the overbought or oversold areas on the chart. Reaching these levels means that the market can soon turn around, but it does not give signal, as in a strong trend the market can stay in the overbought or oversold state for quite a long time. As with most oscillators, the signals are generated when leaving these areas. This indicator allows to display three types of
CCI Signal AM
Andriy Matviyevs'kyy
This indicator displays the signals based on the values of the classic CCI indicator on the price chart. The CCI can be used for determining the overbought or oversold areas on the chart. Reaching these levels means that the market can soon turn around, but it does not give signal, as in a strong trend the market can stay in the overbought or oversold state for quite a long time. As with most oscillators, the signals are generated when leaving these areas. This indicator allows to display three
DeM Signal AM
Andriy Matviyevs'kyy
This indicator displays the moment when the DeMarker oscillator crosses its smoothed value. If the DeMarker oscillator crosses its smoothed value, it is a signal of a trend change. The signal is given after the end of the formation of the candle. The signal is confirmed when the price crosses the high/low of the bar on which the signal was given. The indicator does not redraw. Custom Parameters: DeM_Period (>1) - DeMarker indicator period; MA_Period - period for smoothing DeMarker indicator val
ADX Signal AM
Andriy Matviyevs'kyy
The indicator is an interpretation of the Average Directional Movement Index (ADX) allowing you to determine if there is a price trend. It was developed by Welles Wilder and described in his book "New concepts in technical trading systems". The indicator shows signals on the price chart when +DI и -DI intersect and when an ADX value rises or falls relative to the +DI и -DI positional relationship. The indicator's buy signals work just like a support level, while the sell signals work like a res
Impulsive Trade AM
Andriy Matviyevs'kyy
This indicator is designed for trading based on the trading strategy presented by Alexander Elder. The thick and thin color histograms of the indicator correspond to the values ​​of MACD and OsMA with the parameters set by the user. If the indicator histogram is greater than zero, then the MACD or OsMA value is greater than zero. If the indicator histogram is less than zero, then the MACD or OsMA value is less than zero. As an additional element, the indicator indicates the direction of the mo
RSX Signal AM
Andriy Matviyevs'kyy
The indicator displays the signals of the RSX oscillator. The main type of signal is given when the oscillator exceeds the 0 value. If the "Sensitivity" parameter increases above zero, the main signal will also be given when overbought/oversold levels are overcome, defined as zero plus sensitivity and zero minus sensitivity. An additional signal is given when the direction of the oscillator line changes. It is optimal to use the indicator signals as signals to open a trade when the price overcom
Stop Bar AM
Andriy Matviyevs'kyy
The indicator accurately identifies a short-term trend both on trend and flat markets. The confirmation of the signal is the overcoming by the price of the high/low of the bar on which the signal was given. Signals are given on fully formed bars and are not redrawn. Calculations are based on the system of Moving Averages. The indicator is highly sensitive. Use it together with other technical analysis indicators. Settings: Sensitivity - amount of bars for the indicator calculation (1 or higher)
MFI Signal AM
Andriy Matviyevs'kyy
5 (1)
This indicator displays the signals based on the values of the classic Money Flow Index (MFI) indicator on the price chart. The volume is considered during the calculation of the MFI values. The MFI can be used for determining the overbought or oversold areas on the chart. Reaching these levels means that the market can soon turn around, but it does not give signal, as in a strong trend the market can stay in the overbought or oversold state for quite a long time. As with most oscillators, the
ADX Candles AM
Andriy Matviyevs'kyy
This indicator colors candles in accordance with the projected price movement. The analysis is based on the values of the classic ADX. If the DMI+ line is above the DMI- line - the candlestick is painted in color that signals a price growth; If the DMI+ line is below the DMI- line - the candlestick is painted in color that signals a price fall. The indicator does not redraw on completed candlesticks. The forming candlestick can change its color depending on the current data. Thus, it is recommen
SuperTrend AM
Andriy Matviyevs'kyy
SuperTrend AM is an indicator that allows you to open a position at the very beginning of a significant price movement. The second most important quality of the indicator is the ability to follow the trend as long as possible in order to obtain all potential profits while minimizing potential losses. This indicator does not repaint or not recalculate. A version of this indicator with advanced settings and signal notifications is  SuperTrend 3 AM . Signal of the indicator: red arrow appearing ab
HyperSignal AM
Andriy Matviyevs'kyy
The  indicator generates signals for opening positions. The principle of operation is to compare the current average price with a range of average prices over a longer period. The signals are confirmed when the price exceeds the High/Low of the bar where the indicator generated the signal.  Maintenance of an open position is carried out on a smaller TF. Indicator signals to open an opposite position on a smaller TF are a signal to close the deal. This indicator does not repaint or not recalculat
EasyTrend AM
Andriy Matviyevs'kyy
EasyTrend AM is an indicator that allows you to open a position at the very beginning of a significant price movement. The second most important quality of the indicator is the ability to follow the trend as long as possible in order to obtain all potential profits while minimizing potential losses. This indicator does not repaint or not recalculate. A version of this indicator with advanced settings and signal notifications is EasyTrend 3 AM . Signal of the indicator: red arrow appearing above
ZT Signal AM
Andriy Matviyevs'kyy
The indicator displays elements of the trading system, name trading in the zone, described by Bill Williams. Sell signals are formed when MACD and OsMA values are falling simultaneously (Bill Williams calls these indicators АО and АС in his book), while buy signals appear when both indicators are rising. The indicator has no configurable parameters. (Indicator variant in which MACD and OsMA parameters can be changed - ZT Signal 2 AM ). The indicator signals are confirmed when the price exceeds t
Fine Trade AM
Andriy Matviyevs'kyy
The presented indicator with high efficiency gives signals about the moments of a significant change in the direction of price movement. The indicator is intuitive and easy to use. The indicator signal is generated after the completion of the bar, where the indicator changes its position relative to zero. Never repaints signal. The indicator signals must be confirmed by the price exceeding the High/Low of the bar, where the indicator changed its position relative to zero. The indicator allows to
TTF Line AM
Andriy Matviyevs'kyy
The indicator analyzes TTF and ATR data to define the current trend and allow traders to gain maximum profit from strong price movements. The indicator is intuitively clear: line direction change - trend direction change. Change of the line color warns of a coming direction change. Customized parameters: Ind_Period (>1) - TTF calculation period; Sensitivity (>1) - ATR sensitivity. Alerts - show a dialog box containing user data; Send_Mail - sends an email using an address specified on the Emai
Step RSI AM
Andriy Matviyevs'kyy
The presented indicator is an original development based on the classic technical analysis indicator - RSI. To smooth out sharp fluctuations in the indicator values, a filter is used that cuts off weak changes and focuses the trader's attention on strong fluctuations in the values. The indicator does not repaint on formed bars. For greater efficiency of this indicator, it should be used together with indicators that identify the trend direction, as well as support/resistance levels. The indica
ADX Line AM
Andriy Matviyevs'kyy
The indicator analyzes ADX and ATR data to define the current trend and allow traders to gain maximum profit from strong price movements. The indicator is intuitively clear: line direction change - trend direction change. Change of the line color warns of a coming direction change. Customized parameters: Ind_Period (>1) - ADX calculation period; Sensitivity (>1) - ATR sensitivity. Alerts - show a dialog box containing user data; Send_Mail - sends an email using an address specified on the Email
ADX Candles 2 AM
Andriy Matviyevs'kyy
This indicator colors candles in accordance with the projected price movement. The analysis is based on the values of the classic ADX. If the DMI+ line is above the DMI- line and the main ADX line grows - the candlestick is painted in color that signals a price growth; If the DMI+ line is below the DMI- line and the main ADX line grows - the candlestick is painted in color that signals a price fall. The indicator does not redraw on completed candlesticks. The forming candlestick can change its c
Bulls or Bears AM
Andriy Matviyevs'kyy
5 (1)
The indicator improves the idea implemented in the standard Bulls and Bears indicator. This indicator displays the difference between the High and Low for the current period of time and the values ​​of the channel constructed at the maximum and minimum prices for a longer period. The growth of the indicator values ​​above zero indicates that the High for the current period is greater than the average of the maximum prices for the period chosen as the indicator parameter. This situation in most
Market Pulse AM
Andriy Matviyevs'kyy
5 (1)
The indicator analyzes the direction of the short- and long-term trend over the given periods taking into account market volatility. This approach allows combining high sensitivity of the indicator with a high probability of its signals. The indicator use principle is very simple: indicator histogram above 0 is a buy signal; indicator histogram below 0 is a sell signal; The indicator is not redrawn on completed bars. This indicator is designed for trading pending orders. Thus, the confirmation
HyperSignal 2 AM
Andriy Matviyevs'kyy
The  indicator generates signals for opening positions. The principle of operation is to compare the current closing price with a range of average prices over a longer period. The signals are confirmed when the price exceeds the High/Low of the bar where the indicator generated the signal.  Maintenance of an open position is carried out on a smaller TF. Indicator signals to open an opposite position on a smaller TF are a signal to close the deal. This indicator does not repaint or not recalculat
Laguerre BoB AM
Andriy Matviyevs'kyy
The indicator improves the idea implemented in the standard Bulls and Bears indicator. This indicator displays the difference between the High and Low for the current period of time and the values ​​of the channel constructed at the maximum and minimum prices, which are smoothed by Laguerre method. The growth of the indicator values ​​above zero indicates that the High for the current period is greater than the average of the High prices. This situation in most cases indicates an increase in the
DSS Bressert AM
Andriy Matviyevs'kyy
Double Smoothed Stochastics – DSS Bressert is an oscillator introduced by William Blau and Walter Bressert.  The calculation of DSS Bressert values is similar to the stochastic indicator. The confirmation of the indicator's signal is the overcoming by the price of the high/low of the bar on which the signal was given by the indicator. Settings: Price - the price at which the indicator is calculated; EMA_Period - smoothing period; Stoch_Period - oscillator period; OB_Level - overbought level; O
Line on Osc AM
Andriy Matviyevs'kyy
This indicator combines the best features of a trend indicator and an oscillator. Effective trend detection and short-term price fluctuations. Operating principle: The indicator analyzes price direction using one of many standard oscillators. If the oscillator indicates a change in the direction of price movement, the indicator signals this by placing a small arrow on the chart opposite the bar on which the oscillator gave the corresponding signal. At the same time, the main signal of the indic
Filter:
No reviews
Reply to review
Version 26.0 2023.09.12
Updated to version 26+.
Version 25.1 2023.09.05
Updated.
Version 25.0 2023.08.05
Updated.
Version 1.60 2023.07.06
Updated.
Version 1.50 2023.06.04
New version.