COG Osc 2 AM
- Indicators
- Andriy Matviyevs'kyy
- Version: 27.0
- Updated: 12 September 2024
- Activations: 10
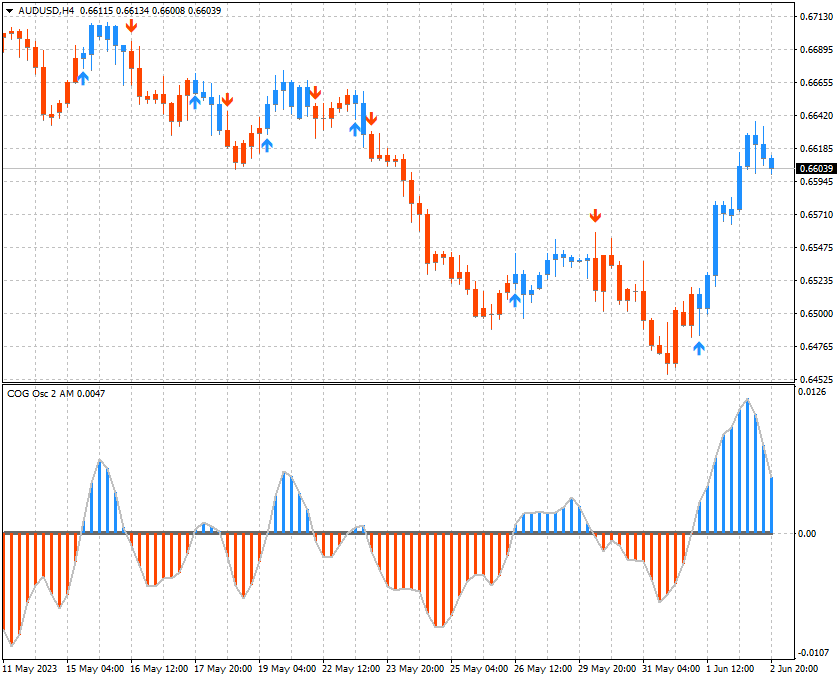
The product is based on J.F. Ehlers' Center of Gravity indicator.
Center of Gravity actually has a zero lag and allows to define turning points precisely.
The indicator is a result of Ehlers' research of adaptive filters.
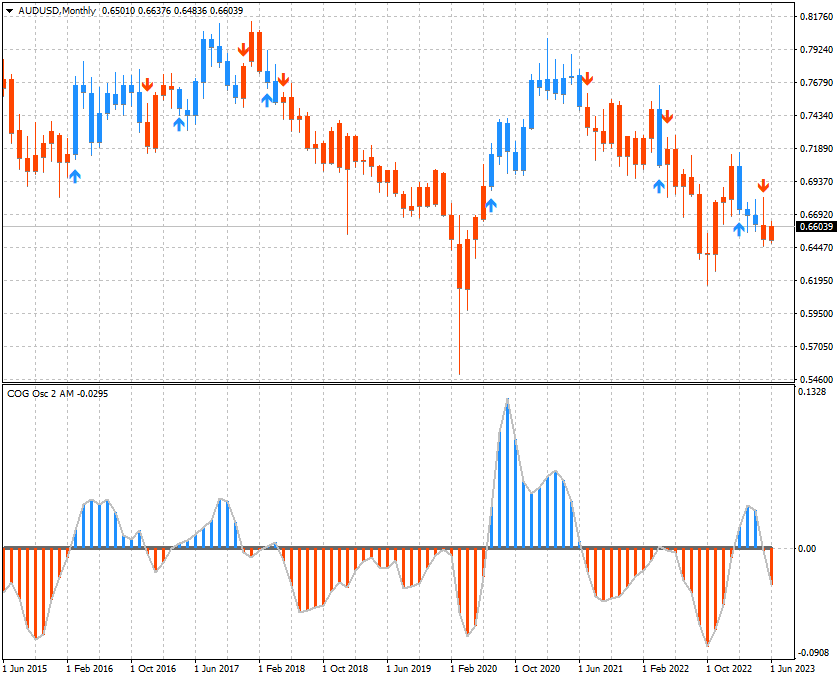
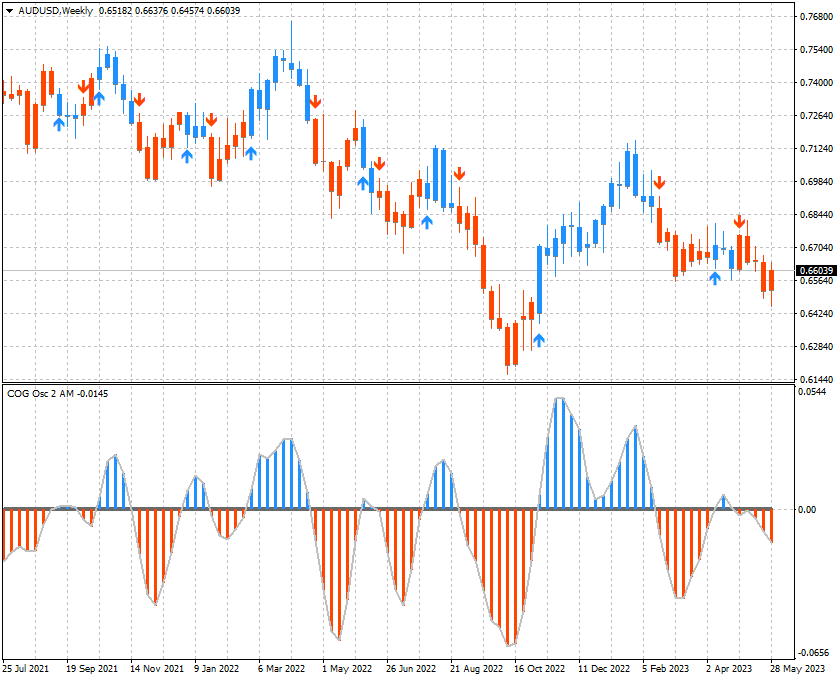
It identifies main pivot points almost without any lag.
The indicator displays the COG oscillator in a separate window.
- Length - indicator calculation period.
- MaPrice - price used to calculate the indicator.
- Signal - indicator display options.
The indicator does not repaint.