Macd Authentic
- Indicators
- Joao Marcilio
- Version: 1.0
The MACD (Moving Average Convergence Divergence) indicator is one of the most widely used technical analysis tools by traders worldwide. Created by Gerald Appel in the 1970s, the MACD is an indicator that helps investors identify the trend direction, trend strength, and possible trend reversal points.
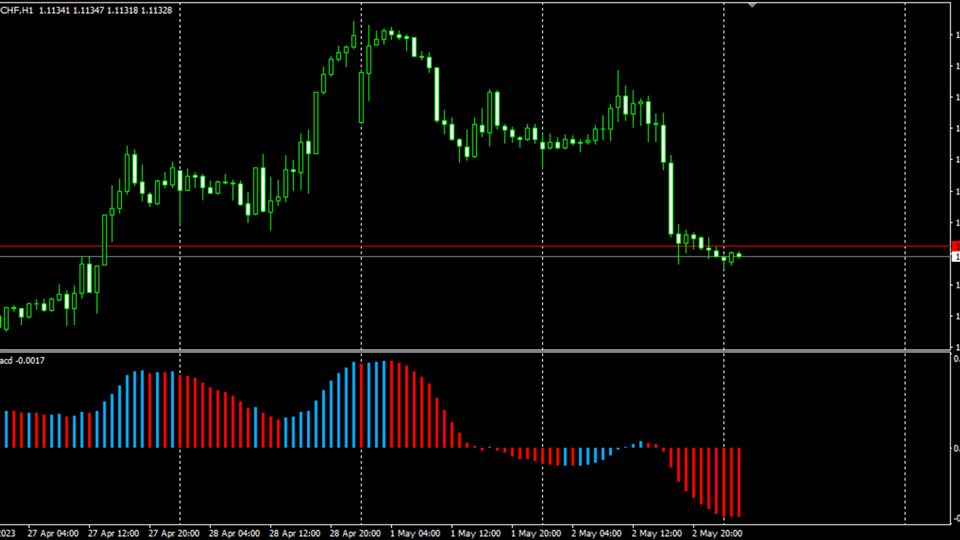
The MACD indicator is composed of a histogram that shows the difference between the 12-period exponential moving average and the 26-period exponential moving average. The top part of the histogram is blue while the bottom is red. When the histogram is above the zero line, it is seen as a buy signal, and when the histogram is below the zero line, it is seen as a sell signal.
The MACD indicator can also be used to identify divergences between the indicator and the asset price. When the asset price makes a new high, but the histogram does not follow, this is known as bearish divergence and may indicate that the uptrend is losing strength. Similarly, when the asset price makes a new low, but the histogram does not follow, this is known as bullish divergence and may indicate that the downtrend is losing strength.
The MACD indicator is a versatile tool that can be applied to a wide range of financial instruments, including stocks, commodities, currencies, and other assets. It is commonly used in conjunction with other technical analysis tools to make informed trading decisions. With its simplicity and effectiveness, the MACD remains a popular tool for traders worldwide.
The Macd Authentic Indicator is a free indicator with several versions widely published on the internet, this is just a version that I put together, I hope you like it. If you want to know the indicators of my authorship, please visit my page here.


