• Overview
  • Reviews (23)
  • Comments (77)
  • What's new

Market Structure Patterns

4.44

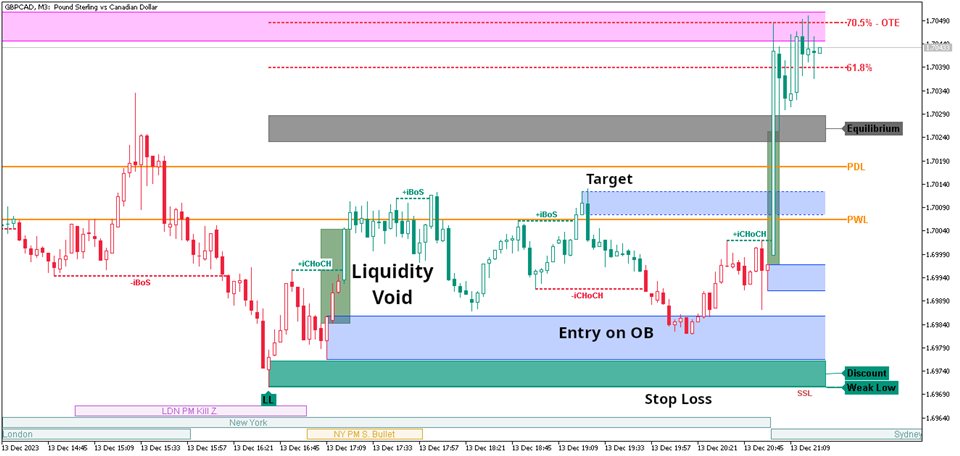
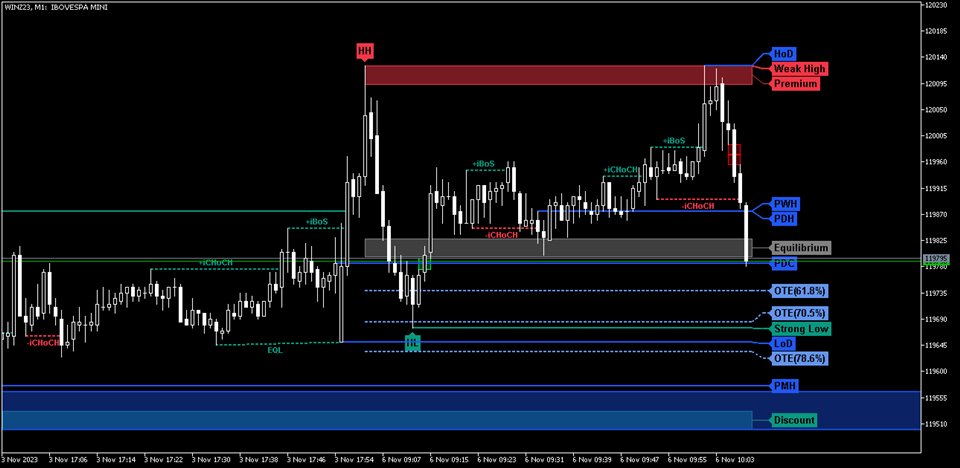
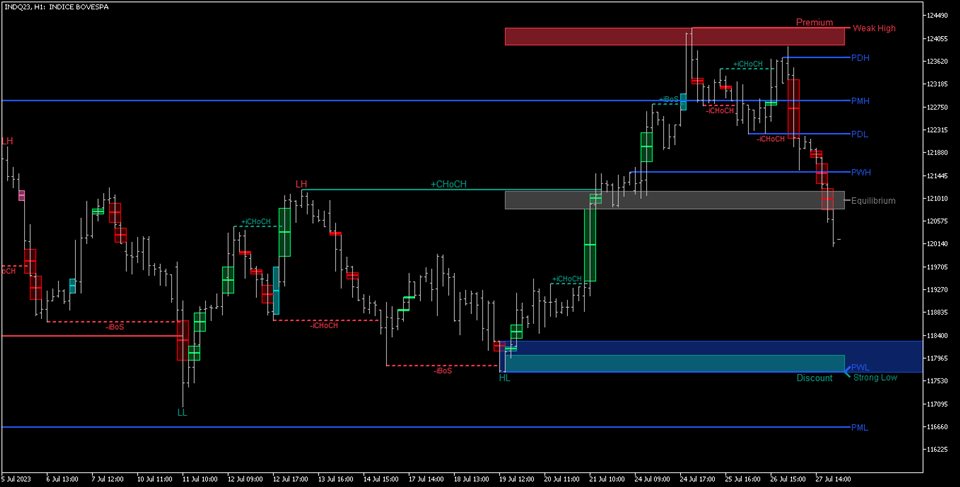
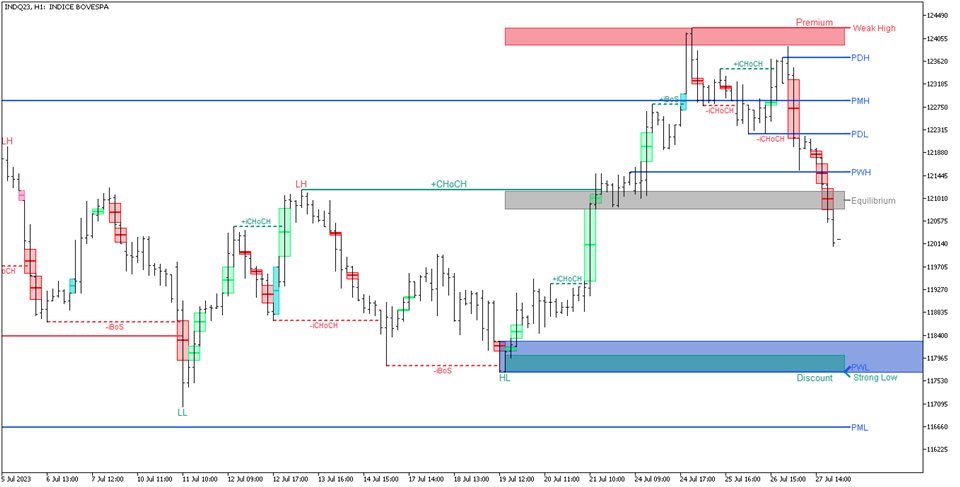
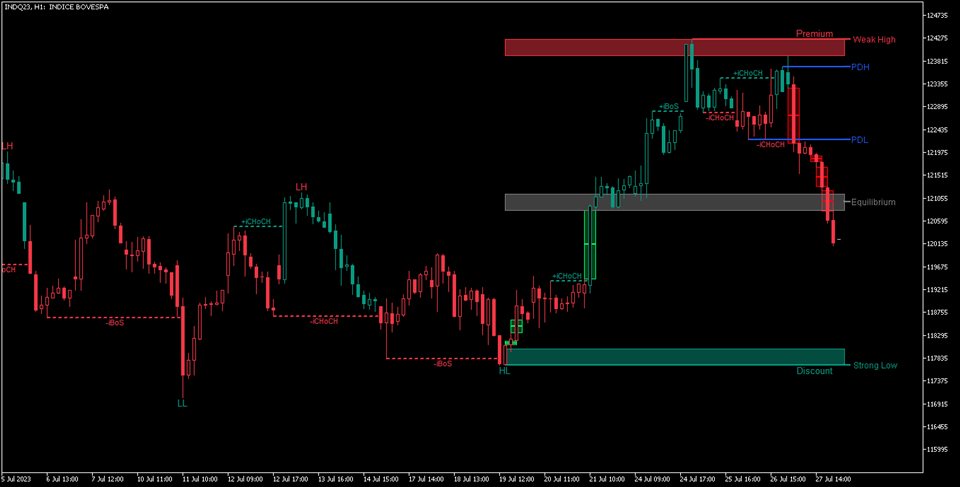
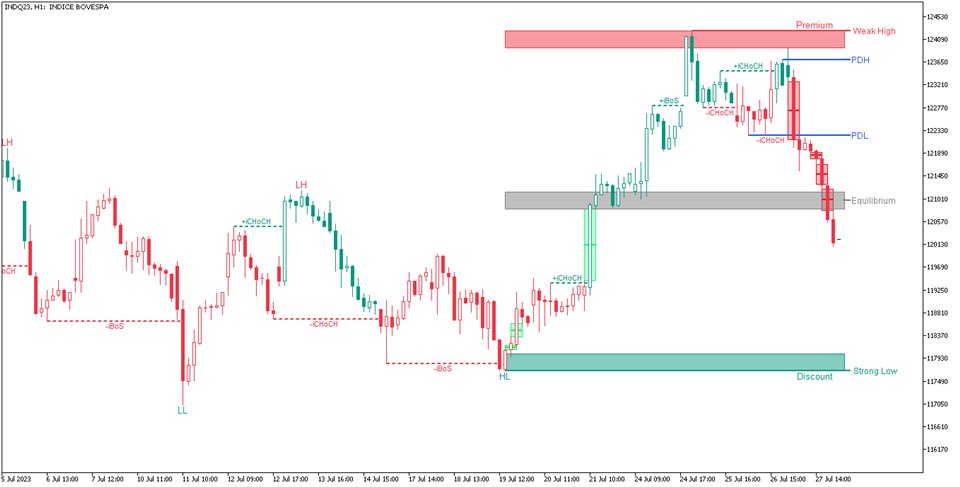
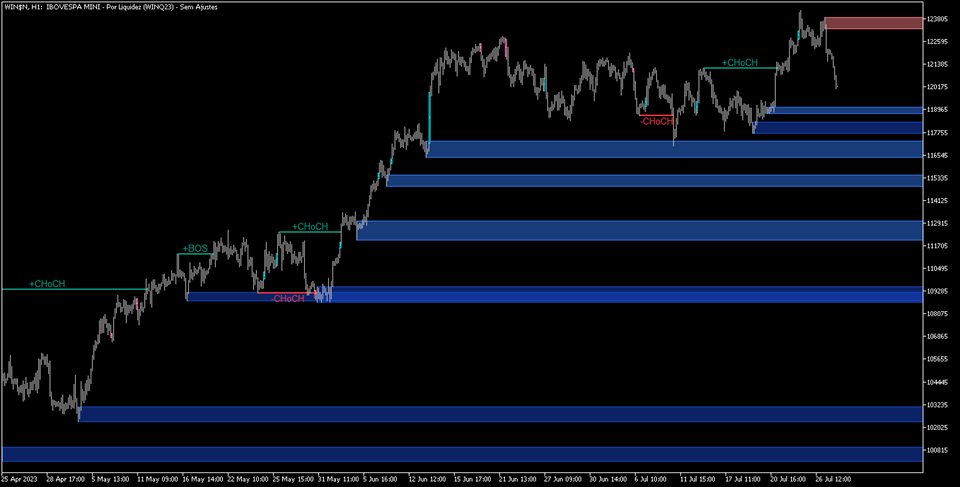
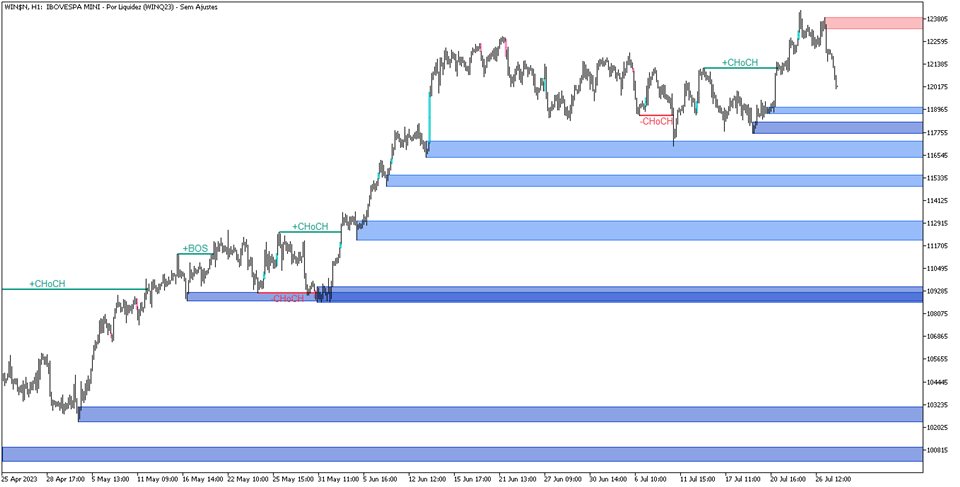
Market Structure Patterns is an indicator based on smart money concepts that displays SMC/ICT elements that can take your trading decisions to the next level. Take advantage of the alerts, push notifications and email messages to keep informed from when an element is formed on the chart, the price crosses a level and/or enters in a box/zone. Developers can access the values of the elements of the indicator using the global variables what allows the automation of trading decisions based on SMC/ICT strategies.

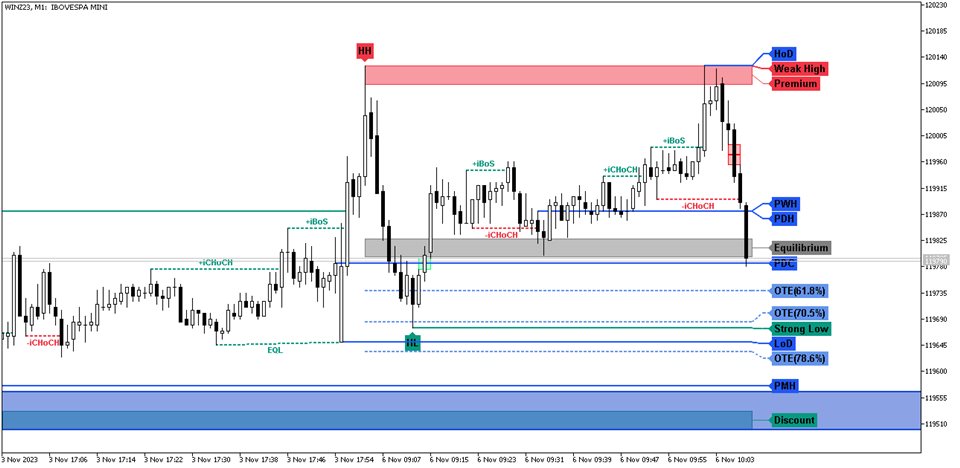
Thinking on high level of customization, the indicator allows to customaze the color and transparency of the element, display the labels using bubble style, display the sessions/trading windows in the bottom of the chart or over the price chart, has an exclusive algorithm to avoid labels/text overlappingpaints the candlesticks depending on the trend and/or internal and swing trend alignment. This feature can be enabled in the parameter "Color Candles". By default the trend is show as green for bullish trend and red for bearish trend. Among with the trend the candlesticks can be filled or not giving the hability to recognize bullish and bearish candlesticks.

Elements and/or Abreviations:

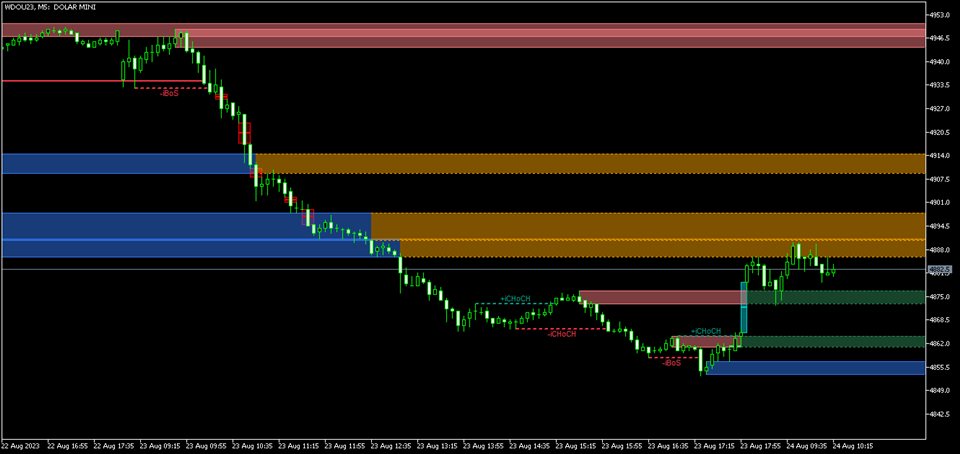
The elements present in the indicator are listed down with their abreviations when applied:

  • Premium, Equilibrium and Discount zones
  • Strong/Weak High/Low
  • Automatic Fibonacci
  • OTE - Optimal Trade Entry
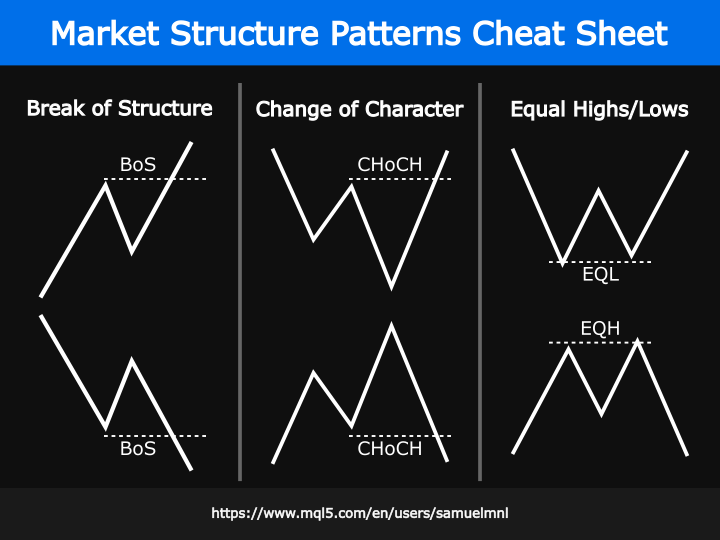
  • HH, HL, LH, LL- Higher highs, higher lows, lower highs and lower lows
  • EQH, EQL - Equal highs and Equal lows
  • BSL, SSL - Buy Stops Liquidity and Sell Stops Liquidity
  • EQH-BSL, EQL-SSL - Buy Stops Liquidity on Equal Highs and Sell Stops Liquidity on Equal Lows
  • BoS, iBoS - Break of structures and Internal Break of Structure
  • CHoCH, iCHoCH - Change of character and Internal Change of Character
  • OB, iOB - Order Blocks and  Internal Order Blocks
  • BB, iBB - Breaker Blocks and Internal Breaker Blocks
  • Liquidity voids
  • FVG - Fair Value Gap
  • InvFVG - Inverse  Fair Value Gap
  • ImpFVG - Implied Fair Value Gap
  • OG - New Day Opening Gap
  • HoD, LoD, OoD - High of the day, Low of the day and Open of the day
  • PDH, PDL, PDO, PDC - Prior day high, low, open and close
  • PWH, PWL , PWO, PWC - Prior week high , low, open and close
  • PMH, PML , PMO, PMC - Prior month high , low, open and close
  • Sessions, Kill Zones and Silver Bullet  Trading Window

Global Variables:

The access to order blocks and structure breaks values through global variables can be made using the names conventions as follow:

// The timeframe to get the data
string timeframe = StringSubstr(EnumToString(_Period), StringLen("PERIOD_"));
string prefix = "SMP-"+_Symbol+"("+timeframe+")", for example "SMP-EURUSD(H4)";

// For bullish order blocks (for bearish just replace 'Bullish' by 'Bearish')
// Add "Bullish-IOB" for internal nullish order blocks or "Bullish-OB" for swing bullish order blocks;
// Add "-Total to get the amount of order blocks on the charts;"
int bullish_iob_total = GlobalVariableGet(prefix+"Bullish-IOB-Total")

// use for loop to get all the values
for(int i=0;i<bullish_iob_total;i++)
{
        // Add "[index]-Top" and/or "[index]-Bot" to get the order blocks values.
        double iob_top = GlobalVariableGet(prefix+"Bullish-IOB["+(string)i+"]-Top");
        double iob_top = GlobalVariableGet(prefix+"Bullish-IOB["+(string)i+"]-Bot");
}

// For structure breaks:
// Add the pattern name as displayed on the chart. For example, +iCHoCH can be accessed by "SMP-EURUSD(H4)-+iCHoCH"

// For Premium/Equilibrium/Discount:
// Add the pattern name followed by the desired level. For example, Premium-Top and Premium-Bot can be accessed respectively by "SMP-EURUSD(H4)-Premium-Top" and "SMP-EURUSD(H4)-Premium-Bot"


The access to the indicator data by buffers indexes was introduced in the version 3.24. The data available is mapped as follow:

Buffer index Data stored in the buffer
0 Internal Top Price
1 Internal Bottom Price
2 Internal Bull Bos
3 Internal Bear Bos
4 Internal Bull Choch
5 Internal Bear Choch
6 Internal Bull Order Block Top
7 Internal Bull Order Block Bottom
8 Internal Bear Order Block Top
9 Internal Bear Order Block Bottom
10 Internal Bull Breaker Block Top
11 Internal Bull Breaker Block Bottom
12 Internal Bear Breaker Block Top
13 Internal Bear Breaker Block Bottom
14 Swing Top Price
15 Swing Bottom Price
16 Swing Bull Bos
17 Swing Bear Bos
18 Swing Bull Choch
19 Swing Bear Choch
20 Swing Bull Order Block Top
21 Swing Bull Order Block Bottom
22 Swing Bear Order Block Top
23 Swing Bear Order Block Bottom
24 Swing Bull Breaker Block Top
25 Swing Bull Breaker Block Bottom
26 Swing Bear Breaker Block Top
27 Swing Bear Breaker Block Bottom
28 BSL Taken
29 SSL Taken
30 EQH Price1
31 EQH Price2
32 EQL Price1
33 EQL Price2
34 Premium Top
35 Premium Bottom
36 Equilibrium Top
37 Equilibrium Bottom
38 Discount Top
39 Discount Bottom
40 Strong High
41 Weak High
42 Strong Low
43 Weak Low
44 Bull FVG Top
45 Bull FVG Bottom
46 Bear FVG Top
47 Bear FVG Bottom
48 Bull Inverse FVG Top
49 Bull Inverse FVG Bottom
50 Bear Inverse FVG Top
51 Bear Inverse FVG Bottom
52 Bull Implied FVG Top
53 Bull Implied FVG Bottom
54 Bear Implied FVG Top
55 Bear Implied FVG Bottom
56 Bull Liquidity Void Top
57 Bull Liquidity Void Bottom
58 Bear Liquidity Void Top
59 Bear Liquidity Void Bottom


Join the Market Structure Patterns channel to download materials available for study and/or additional informations.

Reviews 20
Aruncharan Ganapathy Sivakumar
218
Aruncharan Ganapathy Sivakumar 2024.08.18 00:56 
 

As Greg Nicolas said confirmation arrow gives confidence if added... Thank you author for your dedication

Greg Nicolas
72
Greg Nicolas 2024.05.25 00:28 
 

The Indicator is a top notch but It really took me time to understand it.however, disabling those sessions and OTE which gives direction somehow late and adding a confirmation arrow really makes the difference for me. Kudos to Samuel for a great Job and five star. I have both MT4 & MT5 on fire with Synthetic

pfidelus
127
pfidelus 2024.04.23 13:07 
 

I have tested over 100 different indicators for MT5 and MT4, and I must say that this one is in the top 5 of my favorite indicators. I am able to see everything very clearly, including all key levels, which is amazing for my strategy. I highly recommend this indicator; it has everything you need to make consistent profits. I don't usually write reviews for indicators, but I had to for this one because I found it very useful and helpful.

Recommended products
Owl Smart Levels MT5
Sergey Ermolov
4.07 (28)
MT4 version  |   FAQ The Owl Smart Levels Indicator is a complete trading system within the one indicator that includes such popular market analysis tools as Bill Williams' advanced fractals , Valable ZigZag which builds the correct wave structure of the market, and Fibonacci levels which mark the exact levels of entry into the market and places to take profits. Detailed description of the strategy Instructions for working with the indicator Advisor-assistant in trading Owl Helper Private User
Cumulative delta indicator As most traders believe, the price moves under the pressure of market buying or selling. When someone redeems an offer standing in the cup, the deal is a "buy". If someone pours into the bid standing in the cup - the deal goes with the direction of "sale". The delta is the difference between purchases and sales. A cumulative delta - the difference between the cumulative sum of purchases and sales for a certain period of time. It allows you to see who is currently contr
Renko Gold
Ignacio Agustin Mene Franco
Renko Gold! clearly indicates the floors and ceilings where it goes from 4 lines, the line below that marks the floor in green confirming with the thinnest line clarifies the purchase entry, the same is for sale, the top line marks the ceiling and the thinnest red line marks the sale, This indicator works for all temporalities! For Forex and Synthetic Indices markets! It also works for crypto markets! Good profit! World Investor.
The Penta-O is a 6-point retracement harmonacci pattern which usually precedes big market movements. Penta-O patterns can expand and repaint quite a bit. To make things easier this indicator implements a twist: it waits for a donchian breakout in the right direction before signaling the trade. The end result is an otherwise repainting indicator with a very reliable trading signal. The donchian breakout period is entered as an input. [ Installation Guide | Update Guide | Troubleshooting | FAQ | A
Noize Absorption Index - is the manual trading system that measures the difference of pressure between bears forces and bulls forces. Green line - is a noize free index that showing curent situation. Zero value of index shows totally choppy/flat market.Values above zero level shows how powerfull bullish wave is and values below zero measures bearish forces.Up arrow appears on bearish market when it's ready to reverse, dn arrow appears on weak bullish market, as a result of reverse expectation.
An indicator of pattern #31 ("Long Island") from Encyclopedia of Chart Patterns by Thomas N. Bulkowski. The second gap is in the opposite direction. Parameters: Alerts - show alert when an arrow appears   Push - send a push notification when an arrow appears (requires configuration in the terminal) GapSize - minimum gap size in points ArrowType - a symbol from 1 to 17 ArrowVShift - vertical shift of arrows in points   ShowLevels - show levels ColUp - color of an upward line ColDn - color of a
The Accumulation / Distribution is an indicator which was essentially designed to measure underlying supply and demand. It accomplishes this by trying to determine whether traders are actually accumulating (buying) or distributing (selling). This indicator should be more accurate than other default MT5 AD indicator for measuring buy/sell pressure by volume, identifying trend change through divergence and calculating Accumulation/Distribution (A/D) level. Application: - Buy/sell pressure: above
Double HMA MTF for MT5
Pavel Zamoshnikov
4 (4)
This is an advanced multi-timeframe version of the popular Hull Moving Average (HMA) Features Two lines of the Hull indicator of different timeframes on the same chart. The HMA line of the higher timeframe defines the trend, and the HMA line of the current timeframe defines the short-term price movements. A graphical panel with HMA indicator data from all timeframes at the same time . If the HMA switched its direction on any timeframe, the panel displays a question or exclamation mark with a tex
Terra Infinity is a flat indicator. This improved version of the CalcFlat indicator has three additional lines that significantly increase its effectiveness. Unlike its predecessor with two static levels, Terra Infinity adds three dynamic lines above the main histogram, which are interpreted as follows: base signal line, minimum signal line, maximum signal line. These lines are formed using the additional parameter Avg, which is the average value of the histogram. Averaging produces a line
First of all Its worth emphasizing here that this Trading Tool is Non Repainting , Non Redrawing and Non Lagging Indicator , Which makes it ideal for professional trading . Online course, user manual and demo. The Smart Price Action Concepts Indicator is a very powerful tool for both new and experienced traders . It packs more than 20 useful indicators into one , combining advanced trading ideas like Inner Circle Trader Analysis and Smart Money Concepts Trading Strategies . This indicator focus
PipFinite Trend PRO MT5
Karlo Wilson Vendiola
4.85 (574)
Breakthrough Solution For Trend Trading And Filtering With All Important Features Built Inside One Tool! Trend PRO's smart algorithm detects the trend, filters out market noise and gives entry signals with exit levels. The new features with enhanced rules for statistical calculation improved the overall performance of this indicator. Important Information Revealed Maximize the potential of Trend Pro, please visit www.mql5.com/en/blogs/post/713938 The Powerful Expert Advisor Version Automa
Atomic Analyst MT5
Issam Kassas
4.32 (19)
First of all Its worth emphasizing here that this Trading Indicator is   Non-Repainting   , Non Redrawing and Non Lagging Indicator   Indicator, Which makes it ideal from both manual and robot trading.  User manual: settings, inputs and strategy . The Atomic Analyst  is a PA Price Action Indicator that uses Strength and Momentum of the price to find a better edge in the market. Equipped with Advanced filters which help remove noises and false signals, and Increase Trading Potential. Using Mult
Magic Finger can help you identify trends and trading opportunities clearly. The finger points to the open position signal, and the discoloration line is confirmed by the trend. If you are a day trader, you can choose to trade during a period of active trading, referring to the discoloration line as the basis for the next order, finger signal as a filter. If you are a trend trader, you can choose a period above H1, wait for the appearance of the finger signal in the key price area, and enter t
SolarTrade Suite Financial Indicator: Jupiter Market Indicator - Your Reliable Guide in the World of Financial Markets! This is a trend indicator that uses special innovative and advanced algorithms to calculate its value, and also has an eye-pleasing design. It is very easy to understand the readings of this indicator: blue color - buy, red - sell. Check out our other products from the SolarTrade Suite series at the bottom of the description. Do you want to confidently navigate the wor
Your Trend Friend
Luigi Nunes Labigalini
5 (1)
The trend is your friend! Look at the color of the indicator and trade on that direction. It does not  repaint. After each candle is closed, that's the color of the trend. You can focus on shorter faster trends or major trends, just test what's most suitable for the symbol and timeframe you trade. Simply change the "Length" parameter and the indicator will automatically adapt. You can also change the color, thickness and style of the lines. Download and give it a try! There are big movements
Golden Spike Premium
Kwaku Bondzie Ghartey
Golden Spikes Detector Notice: Limited-Time 50% Discount on All Products   Due to high interest, only a few (about 8) discounted spots remain for   Golden Spikes Premium .  For those interested, all my trading tools, including Golden Spikes Premium, are currently available at a 50% discount until October 30, 2024 . Feel free to take advantage while it lasts. Acknowledgement and Dedications:  The name of this indicator was Inspired by an Original; Mr Grant Koopman; a Knowledgeable and experienced
This is an MTF indicator of support and resistance levels based on Advanced ZigZag Dynamic and/or Extended Fractals indicator extremums with price labels (can be disabled). More higher TFs can be selected for MTF mode. By default, the levels are generated based on ZigZag indicator dots. Fractals indicator dots can also be used together with ZigZag or instead of it. In order to simplify the use and save CPU time, calculation is performed once per each bar at its opening. Parameters: ForcedTF - ch
Was: $249  Now: $99   Market Profile defines a number of day types that can help the trader to determine market behaviour. A key feature is the Value Area, representing the range of price action where 70% of trading took place. Understanding the Value Area can give traders valuable insight into market direction and establish the higher odds trade. It is an excellent addition to any system you may be using. Inspired by Jim Dalton’s book “Mind Over Markets”, this indicator is designed to suit the
Renko System
Marco Montemari
This indicator can be considered as a trading system. It offers a different view to see the currency pair: full timeless indicator, can be used for manual trading or for automatized trading with some expert advisor. When the price reaches a threshold a new block is created according to the set mode. The indicator beside the Renko bars, shows also 3 moving averages. Features renko mode median renko custom median renko 3 moving averages wicks datetime indicator for each block custom notificatio
Premium level is a unique indicator with more than 80% accuracy of correct predictions! This indicator has been tested for more than two months by the best Trading Specialists! The author's indicator you will not find anywhere else! From the screenshots you can see for yourself the accuracy of this tool! 1 is great for trading binary options with an expiration time of 1 candle. 2 works on all currency pairs, stocks, commodities, cryptocurrencies Instructions: As soon as the red ar
This indicator will show you the TP and SL Values (in that currency) that you already set  for every orders on the charts  ( closed to the transaction/order line)  that will help you a lot to estimated your profit and loss for every order.    And it also show you the PIPs values too.  the shown format  is      " Currency Values of our Profit or Loss /  PIPs values ".    The TP Value will be shown in Green Color and  the SL Value  will be shown in Red Color.  For any question or more information,
Mine Farm
Maryna Kauzova
Mine Farm is one of the most classic and time-tested scalping strategies based on the breakdown of strong price levels. Mine Farm is the author's modification of the system for determining entry and exit points into the market... Mine Farm - is the combination of great potential with reliability and safety. Why Mine Farm?! - each order has a short dynamic Stop Loss - the advisor does not use any risky methods (averaging, martingale, grid, locking, etc.) - the advisor tries to get
Ultimate Divergence Scanner (Multi Pair And Multi Time Frame) :   ---LIMITED TIME OFFER: NEXT 25 CLIENTS ONLY ---46% OFF REGULAR PRICE AND 2 FREE BONUSES ---SEE BELOW FOR FULL DETAILS It is a widely known market principle that momentum generally precedes price.  Making divergence patterns a clear indication that price and momentum are not in agreement.  Divergence patterns are widely used by institutional traders around the world. As they allow you to manage  your trades within strictly de
Introduction One of the patterns in "RTM" is the "QM" pattern, also known as "Quasimodo". Its name is derived from the appearance of "Hunchback of Notre-Dame" from Victor Hugo's novel. It is a type of "Head and Shoulders" pattern.   Formation Method   Upward Trend In an upward trend, the left shoulder is formed, and the price creates a new peak higher than the left shoulder peak . After a decline, it manages to break the previous low and move upward again. We expect the pric
Golden Spikes Detector
Batsirayi L Marango
2.67 (3)
Golden Spikes Detector This indicator is based on an advanced strategy primarily for trading spikes on Boom and Crash Indices. Complex algorithms were implemented to detect high probability entries only. It alerts on potential Buy and Sell entries. To trade spikes on the Deriv or Binary broker, only take Buy Boom and Sell Cash alerts. It was optimised to be loaded on 5-minute timeframe although multiple timeframe analysis is done in the background. Features ·             Desktop pop up and sound
How to use Pair Trading Station Pair Trading Station is recommended for H1 time frame and you can use it for any currency pairs. To generate buy and sell signal, follow few steps below to apply Pair Trading Station to your MetaTrader terminal. When you load Pair Trading Station on your chart, Pair Trading station will assess available historical data in your MetaTrader platforms for each currency pair. On your chart, the amount of historical data available will be displayed for each currency pai
Order Book, known also as Market Book, market depth, Level 2, - is a dynamically updated table with current volumes of orders to buy and to sell specific financial instument at price levels near Bid and Ask. MetaTrader 5 provides the means for receiving market book from your broker, but in real time only, without access to its history. The indicator OrderBook Cumulative Indicator accumulates market book data online and visualizes them on the chart. In addition, the indicator can show the market
Delta Aggression Volume PRO is an indicator developed to monitor the strength and continuity of the aggression volume of sell and buy negotiations. Note: This indicator DOES NOT WORK for Brokers and/or Markets WITHOUT the type of aggression (BUY or SELL). Cryptocurrencies and Forex do not provide this type of data, that is, it does not work with them. O Delta Agrression Volume PRO has features that allow you to view beyond the delta volume of the day. Operation Multi symbols  (those who pro
The indicator shows harmonic patterns on the chart without repainting with the minimum possible lag. The search for indicator tops is based on the wave principle of price analysis. Advanced settings allow you to choose parameters for your trading style. At the opening of a candle (bar), when a new pattern is formed, an arrow of the probable direction of the price movement is fixed, which remains unchanged. The indicator recognizes the following patterns and their varieties: ABCD, Gartley (Butter
To download MT4 version please click here . - This is the exact conversion from TradingView: "Trend Direction Force Index - TDFI [wm]" By "causecelebre". - This indicator uses multiple levels of averaging to detect trend strength. - You can optimize filter low and filter high levels to achieve best results. - You have access to buffers to use in EAs. - This is a light-load processing and non-repaint indicator. - You can message in private chat for further changes you need.
Buyers of this product also purchase
TPSproTREND PrO MT5
Roman Podpora
4.89 (9)
TPSpro TREND PRO  - is a trend indicator that automatically analyzes the market and provides information about the trend and each of its changes, as well as giving signals for entering trades without redrawing! The indicator uses each candle, analyzing them separately. referring to different impulses - up or down impulse. Exact entry points into transactions for currencies, crypto, metals, stocks, indices!  Version MT4               DETAILED DESCRIPTION               R ecommended to use with an
TPSpro RFI Levels MT5
Roman Podpora
4.75 (12)
A key element in trading is zones or levels from which decisions to buy or sell a trading instrument are made. Despite attempts by major players to conceal their presence in the market, they inevitably leave traces. Our task was to learn how to identify these traces and interpret them correctly. INSTRUCTIONS    RUS   -    ENG           R ecommended to use with an indicator   -   TPSpro  TREND PRO -  Version MT4 Main functions:: Displaying active zones for sellers and buyers! The indicator show
Quantum TrendPulse
Bogdan Ion Puscasu
5 (1)
Introducing Quantum TrendPulse , the ultimate trading tool that combines the power of SuperTrend , RSI , and Stochastic into one comprehensive indicator to maximize your trading potential. Designed for traders who seek precision and efficiency, this indicator helps you identify market trends, momentum shifts, and optimal entry and exit points with confidence. Key Features: SuperTrend Integration: Easily follow the prevailing market trend and ride the wave of profitability. RSI Precision: Detect
Trend Screener Pro MT5
STE S.S.COMPANY
4.84 (67)
Unlock the Power of Trends Trading with the Trend Screener Indicator: Your Ultimate Trend Trading Solution powered by Fuzzy Logic and Multi-Currencies System! Elevate your trading game with the Trend Screener, the revolutionary trend indicator designed to transform your Metatrader into a powerful Trend Analyzer. This comprehensive tool leverages fuzzy logic and integrates over 13 premium features and three trading strategies, offering unmatched precision and versatility. LIMITED TIME OFFER : Tre
Atbot
Zaha Feiz
4.89 (38)
ATbot : How It Works and How to Use It How It Works The "AtBot" indicator for the MT5 platform generates buy and sell signals using a combination of technical analysis tools. It integrates Simple Moving Average (SMA), Exponential Moving Average (EMA), and the Average True Range (ATR) index to identify trading opportunities. Additionally, it can utilize Heikin Ashi candles to enhance signal accuracy. MQL Channel    Leave a massage after purchase and receive a special bonus gift.  AT AI BOT Auto T
FX Levels is an exceptionally accurate support and resistance indicator that merges the traditional Lighthouse method with an innovative dynamic approach, functioning flawlessly across all trading symbols. This includes currency pairs, indices, stocks, or commodities. FX Levels identifies reversal points and displays them on the chart, which can be ideally utilized as profit targets in your trading activities. In developing FX Levels, we have used our extensive experience with brokers and the v
First of all Its worth emphasizing here that this Trading System is Non-Repainting   , Non Redrawing and Non Lagging Indicator Which makes it ideal from both manual and robot trading .  Online course, manual and download presets. The Smart Trend Trading System MT5 is a comprehensive trading solution tailored for new and experienced traders . It combines over 10 premium indicators and features more than 7 robust trading strategies , making it a versatile choice for diverse market conditions . Tre
FX Power MT5 NG
Daniel Stein
5 (7)
Trading GOLD, and currencies, with the dog walk strategy  - super smart Trading GOLD, and currencies, with the breakout strategy  - super easy Visit our all-new   Stein Investments Welcome Page   to get the latest information, updates and trading strategies. FX Power MT5 NG  is the next generation of our long-time very popular currency strength meter, FX Power.  And what does this next-generation strength meter offer? Everything you have loved about the original FX Power  PLUS GOLD/XAU st
Matrix Arrow Indicator MT5
Juvenille Emperor Limited
5 (13)
Matrix Arrow Indicator MT5  is a unique 10 in 1 trend following   100% non-repainting  multi-timeframe indicator that can be used on all symbols/instruments:   forex,   commodities,   cryptocurrencies,   indices,   stocks .  Matrix Arrow Indicator MT5  will determine the current trend at its early stages, gathering information and data from up to 10 standard indicators, which are: Average Directional Movement Index (ADX) Commodity Channel Index (CCI) Classic Heiken Ashi candles Moving Aver
PZ Swing Trading MT5
PZ TRADING SLU
5 (4)
Protect against whipsaws: revolutionize your swing trading approach Special Offer: Purchase now to receive free bonuses worth $135! (Read more for details) Swing Trading is the first indicator designed to detect swings in the direction of the trend and possible reversal swings. It uses the baseline swing trading approach, widely described in trading literature. The indicator studies several price and time vectors to track the aggregate trend direction and detects situations in which the market i
Introducing   Quantum Breakout PRO , the groundbreaking MQL5 Indicator that's transforming the way you trade Breakout Zones! Developed by a team of experienced traders with trading experience of over 13 years,   Quantum Breakout PRO   is designed to propel your trading journey to new heights with its innovative and dynamic breakout zone strategy. Quantum Breakout Indicator will give you signal arrows on breakout zones with 5 profit target zones and stop loss suggestion based on the breako
FX Volume MT5
Daniel Stein
4.93 (14)
Visit our all-new   Stein Investments Welcome Page   to get the latest information, updates and trading strategies. FX Volume is the FIRST and ONLY volume indicator that provides a REAL insight into the market sentiment from a broker's point of view. It provides awesome insights into how institutional market participants, like brokers, are positioned in the Forex market, much faster than COT reports. Seeing this information directly on your chart is the real game-changer and breakthrough solut
Top indicator for MT5   providing accurate signals to enter a trade without repainting! It can be applied to any financial assets:   forex, cryptocurrencies, metals, stocks, indices .  Watch  the video  (6:22) with an example of processing only one signal that paid off the indicator! MT4 version is here It will provide pretty accurate trading signals and tell you when it's best to open a trade and close it. Most traders improve their trading results during the first trading week with the help of
How many times have you bought a trading indicator with great back-tests, live account performance proof with fantastic numbers and stats all over the place but after using it, you end up blowing your account? You shouldn't trust a signal by itself, you need to know why it appeared in the first place, and that's what RelicusRoad Pro does best! User Manual + Strategies + Training Videos + Private Group with VIP Access + Mobile Version Available A New Way To Look At The Market RelicusRoad is
Blahtech Supply Demand MT5
Blahtech Limited
4.54 (13)
Was: $299  Now: $99   Supply Demand uses previous price action to identify potential imbalances between buyers and sellers. The key is to identify the better odds zones, not just the untouched ones. Blahtech Supply Demand indicator delivers functionality previously unavailable on any trading platform. This 4-in-1 indicator not only highlights the higher probability zones using a multi-criteria strength engine, but also combines it with multi-timeframe trend analysis, previously confirmed swings
Best Solution for any Newbie or Expert Trader! This Indicator is a unique, high quality and affordable trading tool because we have incorporated a number of proprietary features and a new formula. With only ONE chart you can read Currency Strength for 28 Forex pairs! Imagine how your trading will improve because you are able to pinpoint the exact trigger point of a new trend or scalping opportunity? User manual:   click here That's the first one, the original! Don't buy a worthless wannabe clone
Quantum Trend Sniper
Bogdan Ion Puscasu
4.71 (49)
Introducing   Quantum Trend Sniper Indicator , the groundbreaking MQL5 Indicator that's transforming the way you identify and trade trend reversals! Developed by a team of experienced traders with trading experience of over 13 years,   Quantum Trend Sniper Indicator   is designed to propel your trading journey to new heights with its innovative way of identifying trend reversals with extremely high accuracy. ***Buy Quantum Trend Sniper Indicator and you could get Quantum Breakout Indicator fo
Identify over 30 candlestick patterns with precision Special Offer: Purchase now to receive free bonuses worth $60! (Read more for details) This indicator recognizes over 30 Japanese Candlestick Patterns and highlights them beautifully on the chart. It is simply one of those indicators price action traders can't live without.  [ Installation Guide | Update Guide | Troubleshooting | FAQ | All Products ] Boost your technical analysis overnight Detect japanese candlestick patterns easily Trade
IX Power MT5
Daniel Stein
4.17 (6)
IX Power   finally brings the unbeatable precision of FX Power to all your trading symbols. It accurately determines the intensity of short, medium and long-term trends in your favourite indices, stocks, commodities, ETFs, and even cryptocurrencies. You can   analyse everything   your terminal has to offer. Try it out and experience how   your timing improves significantly   when trading. Read about our latest strategic development -  Easy scalping with IX Power Visit our all-new   Stein Inve
Italo Trend Indicator MT5
Italo Santana Gomes
4.89 (9)
BUY INDICATOR AND GET EA FOR FREE AS A BONUS + SOME OTHER GIFTS! ITALO TREND INDICATOR  is the best trend indicator on the market, the Indicator works on all time-frames and assets, indicator built after 7 years of experience on forex and many other markets. You know many trend indicators around the internet are not complete, does not help, and it's difficult to trade, but the Italo Trend Indicator is different , the Italo Trend Indicator shows the signal to buy or sell, to confirm the signal t
Trend Forecaster
Alexey Minkov
5 (6)
The Trend Forecaster indicator utilizes a unique proprietary algorithm to determine entry points for a breakout trading strategy. The indicator identifies price clusters, analyzes price movement near levels, and provides a signal when the price breaks through a level. The Trend Forecaster indicator is suitable for all financial assets, including currencies (Forex), metals, stocks, indices, and cryptocurrencies. You can also adjust the indicator to work on any time frames, although it is recommen
XQ Indicator MetaTrader 5
Marzena Maria Szmit
3 (2)
Step into the realm of Forex trading with confidence and precision using XQ, a cutting-edge Forex indicator designed to elevate your trading game to unprecedented heights. Whether you're a seasoned trader or just stepping into the world of currency exchange, XQ Forex Indicator empowers you with the insights and signals needed to make informed trading decisions. The signal conditions are a combination of three indicators, and XQ Forex Indicator only display  medium and long-term trends . The ind
Gold TMAF MTF  - this is a best stock technical indicator. The indicator algorithm analyzes the price movement of an asset and reflects volatility and potential entry zones. The best indicator signals: For SELL = red upper boundary of TMA2 above the red upper boundary of TMA1 + red fractal indicator above + yellow SR signal arrow in the same direction. For BUY = blue lower boundary of TMA2 below the blue lower boundary of TMA1 + blue fractal indicator from below + aqua SR signal arrow in the s
TPA True Price Action indicator reveals the true price action of the market makers through 100% non-repainting signals strictly at the close of a candle! TPA shows entries and re-entries, every time the bulls are definitely stronger than the bears and vice versa. Not to confuse with red/green candles. The shift of power gets confirmed at the earliest stage and is ONE exit strategy of several. There are available now two free parts of the TPA User Guide for our customers. The first "The Basics"
Support And Resistance Screener Breakthrough unique Solution With All Important levels analyzer and Markets Structures Feature Built Inside One Tool ! Our indicator has been developed by traders for traders and with one Indicator you will find all Imporant market levels with one click. LIMITED TIME OFFER : Support and Resistance Screener Indicator is available for only 50 $ and lifetime. ( Original price 125$ ) (offer extended) The available tools ( Features ) in our Indicator are :  1. HH-LL
FX Market Correlation indicator calculates the weakness/strength from all 28 currency pairs in the market. This is unique and powerful way of watching the market. It works on all timeframes. You can use it for scalping, or you can use it for long term trading. FX Market Correlation indicator is NOT repainting. Features: --------- -easy determine which currency is strengthening and which is weakening -choose best currency pairs to trade and times to trade them -find correlation between pairs -N
"The Squeeze indicator attempts to identify periods of consolidation in a market. In general the market is either in a period of quiet consolidation or vertical price discovery. By identifying these calm periods, we have a better opportunity of getting into trades with the potential for larger moves. Once a market enters into a "squeeze," we watch the overall market momentum to help forecast the market direction and await a release of market energy." The Modified TTM Squeeze Indicator is a modi
Auto Order Block with break of structure based on ICT and Smart Money Concepts (SMC) Futures Break of Structure ( BoS )             Order block ( OB )            Higher time frame Order block / Point of Interest ( POI )    shown on current chart           Fair value Gap ( FVG ) / Imbalance   -  MTF      ( Multi Time Frame )    HH/LL/HL/LH  -  MTF      ( Multi Time Frame )  Choch  MTF      ( Multi Time Frame )  Volume Imbalance     ,  MTF          vIMB Gap’s Power of 3 Equal High
Gann Squares Indicator: Analyzing Markets with Geometric Patterns The Gann Squares indicator is a powerful tool for market analysis that draws upon the mathematical concepts introduced by W.D. Gann in his article on "Mathematical Formula for Market Predictions." This indicator incorporates Gann's techniques involving square numbers such as 144, 90, and 52, as well as the Square of 9. Additionally, it incorporates  method for utilizing the Square of 9 in conjunction with channels and the star pa
Dark Absolute Trend   is an Indicator for intraday trading. This Indicator is based on   Trend Following  strategy but use also candlestick patterns and Volatility. We can enter in good price with this Indicator, in order to follow the main trend on the current instrument. It is advised to use low spread ECN brokers. This Indicator does   Not repaint   and   N ot lag . Recommended timeframes are M5, M15 and H1. Recommended working pairs: All. I nstallation and  Update Guide   -  Troubleshooting
More from author
Market Structure Patterns MT4
Samuel Manoel De Souza
5 (16)
Market Structure Patterns   is an indicator based on   smart money concepts   that displays   SMC/ICT   elements that can take your trading decisions to the next level. Take advantage of the   alerts ,   push notifications   and   email messages   to keep informed from when an element is formed on the chart, the price crosses a level and/or enters in a box/zone. Developers can access the values of the elements of the indicator using the   global variables  what allows the automation of trading
Visual Book on Chart
Samuel Manoel De Souza
4.38 (8)
Visual Book on Chart is an indicator designed specially for stocks and futures market. To check if you can use the tool with your Broker open the MT5 Depth Of Market on your terminal and check if there are price and volume data available.  Learn more about the MT5 Depth Of Market in the oficial page. The indicator shows the depth of market data on the chart window and use gradient  based on the market data to colorize the histogram bars. The indicator is formed by two components: The panel, whic
FREE
VWAP Tools
Samuel Manoel De Souza
VWAP Tools features Daily VWAP , Weekly VWAP , Monthly VWAP , Anchored VWAP , VWAP by session and Drawing Panel to add, remove and change properties of multiple anchored VWAPs in a single indicator. With the panel of VWAP Tools you can: Draw VWAPs with a specific time interval or extend the VWAPs to the current bar time Change the properties of each VWAP individually Select a VWAP by clicking over it Delesect a VWAP by clicking anywhere on the chart Use any VWAP already drawn on the chart to dra
FREE
Tabajara Rules II The Best for MT5
Samuel Manoel De Souza
4.88 (8)
Tabajara Rules for MT5 , baseado em Setup Tabajara do professor André Machado, indica a direção do mercado com base em médias móveis quando tem velas na mesma direção da média móvel. O indicador contém a regra de coloração aplicada aos candles e a média móvel. O indicador permite a alteração dos parâmetros: período e método de suavização da média móvel. O indicador permite a alteração das cores dos candles ( contornos e preenchimento) e da média móvel. O modelo do professor André Machado c
FREE
Bollinger Clouds
Samuel Manoel De Souza
The Indicator indicator draws 2 clouds based on Bollinger Bands indicator values. The upper cloud is formed by the upper lines values and the lower cloud by the lowers lines values. The indicator allows to change the Bollinger Bands parameters and the clouds colors the period of the base line and the deviations of each Bollinger Bands instance. The indicator holds 5 buffer index as follow: [0] - Outer values of the upper cloud [1]  - Inner values of the upper cloud [2]  - Base/Center line values
FREE
Envelopes Clouds
Samuel Manoel De Souza
The Indicator indicator draws 2 clouds based on Envelopes indicator values. The upper cloud is formed by the upper lines values and the lower cloud by the lowers lines values. The indicator allows to change the Envelopes parameters and the clouds colors the period of the base line and the deviations of each Envelopes instance. The indicator holds 5 buffer index as follow: [0] - Outer values of the upper cloud [1]  - Inner values of the upper cloud [2]  - Base/Center line values [3]  - Inner valu
FREE
Donchian Clouds
Samuel Manoel De Souza
The Indicator indicator draws 2 clouds based on Donchian Channels indicator values. The upper cloud is formed by the upper lines values and the lower cloud by the lowers lines values. The indicator allows to change the Channels parameters and the clouds colors the period of the base line and the multiplier of each Donchian Channels instance. The indicator holds 5 buffer index as follow: [0] - Outer values of the upper cloud [1]  - Inner values of the upper cloud [2]  - Base/Center line values [3
FREE
Keltner Clouds
Samuel Manoel De Souza
The Indicator indicator draws 2 clouds based on Keltner indicator values. The upper cloud is formed by the upper lines values and the lower cloud by the lowers lines values. The indicator allows to change the Keltner parameters and the clouds colors the period of the base line and the deviations of each Keltner instance. The indicator holds 5 buffer index as follow: [0] - Outer values of the upper cloud [1]  - Inner values of the upper cloud [2]  - Base/Center line values [3]  - Inner values of
FREE
Filter:
Aruncharan Ganapathy Sivakumar
218
Aruncharan Ganapathy Sivakumar 2024.08.18 00:56 
 

As Greg Nicolas said confirmation arrow gives confidence if added... Thank you author for your dedication

Greg Nicolas
72
Greg Nicolas 2024.05.25 00:28 
 

The Indicator is a top notch but It really took me time to understand it.however, disabling those sessions and OTE which gives direction somehow late and adding a confirmation arrow really makes the difference for me. Kudos to Samuel for a great Job and five star. I have both MT4 & MT5 on fire with Synthetic

pfidelus
127
pfidelus 2024.04.23 13:07 
 

I have tested over 100 different indicators for MT5 and MT4, and I must say that this one is in the top 5 of my favorite indicators. I am able to see everything very clearly, including all key levels, which is amazing for my strategy. I highly recommend this indicator; it has everything you need to make consistent profits. I don't usually write reviews for indicators, but I had to for this one because I found it very useful and helpful.

Agbakeleke Idowu
564
Agbakeleke Idowu 2024.04.21 23:47 
 

Very Useless Indicator Very Stupid creator... Very Lazy creator... People have advised him to add confirmation arrows for buy and Sell with TP and SL. Yet He kept saying all manners of rubbish. Clients are always first and then you last... Most worst indicator on Mql5

Samuel Manoel De Souza
28389
Reply from developer Samuel Manoel De Souza 2024.10.12 18:44
You're not a fair person, deleting old reviews and complaining about things not promised in the description.
Alia Kaliner
28
Alia Kaliner 2024.03.20 10:34 
 

Please send me the documentation.

bijae
109
bijae 2023.12.16 11:09 
 

This 3.0 update just made this indicator 10x more powerful and undervalued at the same time! Sam is simply the best! Keep it up!

piola
39
piola 2023.11.23 01:41 
 

This indicator is amazing

elifranck gouvea
62
elifranck gouvea 2023.10.10 03:46 
 

Ainda nÃo consegui fazer uma boa análise pelo indicador, que tal fazer um video explicativo do mesmo?

YouLan
36
YouLan 2023.09.02 06:06 
 

User didn't leave any comment to the rating

Saep Mulyana
190
Saep Mulyana 2023.07.28 09:51 
 

good

afreitas
19
afreitas 2023.07.17 02:13 
 

User didn't leave any comment to the rating

999107
90
999107 2023.07.01 09:11 
 

Very Excellent Indicator Much Appreciated for your good work. Thank You Would please send me the Documentation, Just Bought this indicator.

Truta Petru Lucian
283
Truta Petru Lucian 2023.06.28 22:02 
 

Excellent indicator

BINARY VADER
34
BINARY VADER 2023.06.27 15:14 
 

Doesn't Work on New Update of MT5 ;Please Help

munis
19
munis 2023.06.11 12:38 
 

Hello, The indicator was fantastic but My Mt5 was updated and the indicator doesn't work again. Is there any manual that can guide how to rectify this before given my rating.

It's back working perfectly with awesome new features. I give 5 star

Alejandro Estan Fraga Salinas
445
Alejandro Estan Fraga Salinas 2023.05.17 07:11 
 

Very good indicator. Everything you need for a successful manual trading. Adding a trading assistant will complete the pack Thanks Wellington !

Aravind Kolanupaka
8935
Aravind Kolanupaka 2023.05.11 21:26 
 

Good work. I love this indicator.

Collins M
42
Collins M 2023.05.04 23:12 
 

I can confidently say this is THE BEST indicator out there. Great work author

drzocker
162
drzocker 2023.05.03 20:27 
 

Gute Arbeit !! Nice and Good Work !! Hope of Updates

Matimba Maluleka
24
Matimba Maluleka 2023.05.02 13:20 
 

User didn't leave any comment to the rating

12
Reply to review
Version 3.28 2024.10.19
Error when change timeframe/symbol with Implied FVG enabled has been fixed.
Version 3.27 2024.10.18
- Bugs in the new bar event have been fixed.
- Other preventive updates.
Version 3.24 2024.09.12
- Addition of buffers. The buffers mapping can be checked in the product description page.
- Number of order/breaker blocks now is applied for bullish an bearish separately, For example in previous version if you enter 5 in the inputs, you would see only 5 order blocks in total, for example 3 bullish and 2 bearish. Now it considers 5 bullish and 5 bearish, so you can see 10 order blocks in total.
- The order blocks in global variables was updated to reflect the above change. Check description to know how it if formated now.
- Correction of alert for bearish order/breaker blocks.
Version 3.23 2024.07.29
Fibonacci levels alert updates.
Version 3.21 2024.06.18
Fixed errors:
- Array out of range in some symbols and/or timeframes.
Version 3.20 2024.06.17
- Correction for higher timeframe inverse fvg.
- Added Premium/Discount to global variables.
Version 3.19 2024.06.06
Added MTF FVGs and his corresponding alerts.
Version 3.16 2024.04.22
New features
- New alerts for FVG, Inverse FVG and Implied FVG
- Alerts now can be triggered once per bar by the amount set in the parameters for Premium, Equilibrium and Discounts zones
Version 3.15 2024.04.21
Fixed errors:
- Invalid pointer error when show inverse fvg is disabled.
Version 3.14 2024.04.19
New features:
- Inverse Fair Value Gaps
Version 3.13 2024.04.17
Fixed errors:
- Rectangle of sessions when displaying at price
Version 3.12 2024.04.16
Fixed errors:
- Prev. day ohlc line color
- FVG on daily timeframe
Defaults changed:
- Default color or Previous day/week/month ohlc
New features:
- Define a default font size for all labels and custom font size for each label
Version 3.11 2023.12.18
- Added Implied Fair Value Gap (IFVG)
- Quick fix for breaker block displayed with order block
Version 3.0 2023.12.15
- Updates to default settings
- Candles colors bugs fixed
- Labels organization bugs fixed
- FVG bugs fixed
- Higher timeframe OHLC values bugs fixed
- Candle color now updates in real time
- Candle color can be customized for internal trend and internal & swing trend alignment
- Now is possible to select between two label style
- Updates to Higher timeframe OHLC values
- Structure break type selection now applies to both bullish and bearish
- Breaker Blocks is made independently of Order Blocks.
- Breaker Blocks has more display options. To hide Breaker Blocks just select option 'None' in the drop-down list
- Fibonacci & OTE color can be different for bullish and bearish scenarios
- Added sessions preconfigured for Forex sessions, Silver Bullet and Kill Zone time ranges
- Added Buy/Sell Stops Liquidity (BSL/SSL)
- Added Liquidity Voids
- New alerts options
Version 2.23 2023.10.30
Updates to labels design
Added High/Low of day (HoD/LoD)
Added alerts to Premium/Discount
Added Fibonacci/OTE levels
Improvements to Swing algorithm
Improvements to Premium/Discount algorithm
Fix to use of color NONE.
Adjustable internal structure length.
The indicator was reduced to a single chart object.
Maximum compatibility between MT4 and MT5 versions.
Version 2.22 2023.08.24
- Added Breaker Blocks
- Added Breaker Alerts
- Added symbol and timeframe to the subject of email alerts
- More labels updates.
Version 2.21 2023.08.02
- Added alerts for order blocks touch.
- Updates for labels display.
Version 2.2 2023.07.28
- Prior Highs and Lows anchor points bug fixed.
- Auto-adjustable labels. Now the labels on the right side of the chart will not overlap.
- Added the Opening Gaps (OG) pattern.
- Added the 50% line on the FVGs.
- Added alerts for new FVGs and OGs.
- Remove the filled FVGs now is optional. By default is set to false.
Version 2.1 2023.07.13
Allowance to access BoS and CHoCH values through Global Variables.
The global variable names are given by "SMP-"+_Symbol+"("+TIMEFRAME+")-"+"PatternName", for example "SMP-EURUSD(H4)-+iBoS", "SMP-EURUSD(H4)--iCHoCH", etc;
Version 2.0 2023.05.29
Division by zero error fixed.
Color candles now is false by default.
Added order blocks access through global variables. The global variables names conventions is as follow.
- The names prefixes are given by the "SMP-"+_Symbol+"("+TIMEFRAME+")", for example "SMP-EURUSD-H4";
- Add "-IOB" for internal order blocks or "-OB" for swing order blocks;
- Add "-Total to get the amount of order blocks on the charts;"
- Add "[index]-Top" and/or "[index]-Bot" to get the order blocks values.
Version 1.9 2023.05.20
Update to LL and HL labels.
Update to Premium/Discount labels.
Update to Strong/Weak High/Low labels.
Update to Strong/Weak High/Low line styles.
Version 1.8 2023.05.14
Order blocks colors bug fixed.
Version 1.7 2023.05.07
Alert conditions update.
Structures labels updated to match alerts identifiers.
Version 1.6 2023.05.07
Addition of alert types and conditions.
It includes a special alert type, that sends a custom event to any program in the same chart, which can be used to build Expert Advisor based on this indicator.
The alert information is sent as a string combination in case of multiple alerts on the same candle. For example, sparam = "+CHoCH|+OB", in this case there are two alerts, separated by the character '|'.
Version 1.5 2023.05.02
Corrections:
- Correction of drawings while scrolling the chart.
Version 1.4 2023.05.02
Corrections:
- Texts "Week High" and "Week Low" updated to "Weak High" and "Weak Low".
- Update to avoid division by zero.
- Fixed the drawing delay on new bars seen in Strategy tester.
Version 1.2 2023.04.27
Bug fixed: strange vertical line on last candle.
Version 1.1 2023.04.26
Bug fixes for EQH and EQL on Daily, weekly and monthly timeframes.
Prior highs and lows filtering based on chart timeframe.