Support Resistance Propulsion Targets
- Indicators
- LEE SAMSON
- Version: 1.30
- Updated: 9 May 2023
- Activations: 10
Automatically draw support and resistance levels PLUS propulsion candle gaps on your chart, so you can see where price is likely to head next and/or potentially reverse.
This indicator is designed to be used as part of the position trading methodology taught on my website (The Market Structure Trader) and displays key information for targeting and potential entries.
MT version available here: https://www.mql5.com/en/market/product/97973
There are 2 CORE features in the indicator and 4 additional ones:
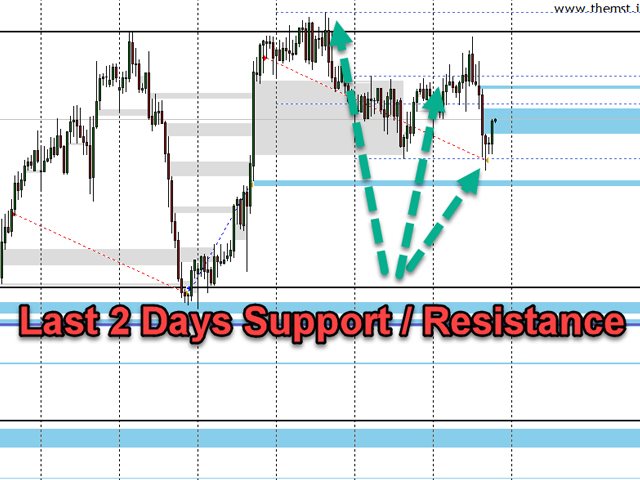
CORE FEATURE 1 - Automatic Support & Resistance Lines For Daily, Weekly & Monthly Timeframes
The indicator draws in the most recent support and resistance levels automatically from the last 2 days and up to 6 weeks and months ago for you. You can fully customize the look of these levels to suit you and display how many are shown. These key levels often act as major support and resistance zones where price will turn and either pull back from or reverse. They are also targets that price will head to, so you can quickly see the potential distance available for a trade before it is likely to turn.
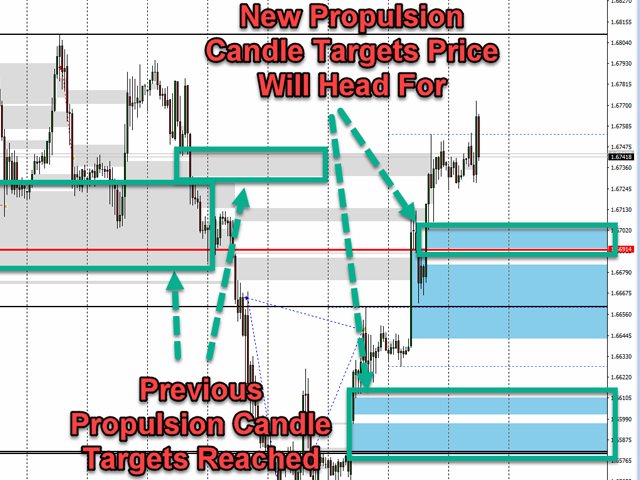
CORE FEATURE 2 - Propulsion Candle Gap Targets
Propulsion gap candles are strong, fast moves created by banks and institutions by executing large positions in any market. These large candles serve two key purposes once they have formed.
1. They act as a directional signal, as the large market participants have chosen a direction which price will often continue to move in for a period of time once they have happened.
2. More importantly, they act as targets as these areas will often leave other big player caught "offside" in their positions and price will retrace back to these levels the vast majority of the time (see screenshots).
Propulsion candle gaps are useful when entering trades, mainly for targeting purposes, so you can see where the most probable finishing point of a move will be. We know these areas are re-tested more than 90% of the time within a short period. Regardless of your reason for entering a trade, it can be hugely beneficial to KNOW WHERE PRICE IS HEADING with a high degree of certainty. You can use them for making important decisions if you trade based on risk:reward too. If you are targeting a certain risk:reward ratio with your trading, but you cannot see a potential propulsion candle gap target within your range, or you see one which is too close, this can help you decide whether a trade is viable to take or not.
***ADDITIONAL FEATURES***
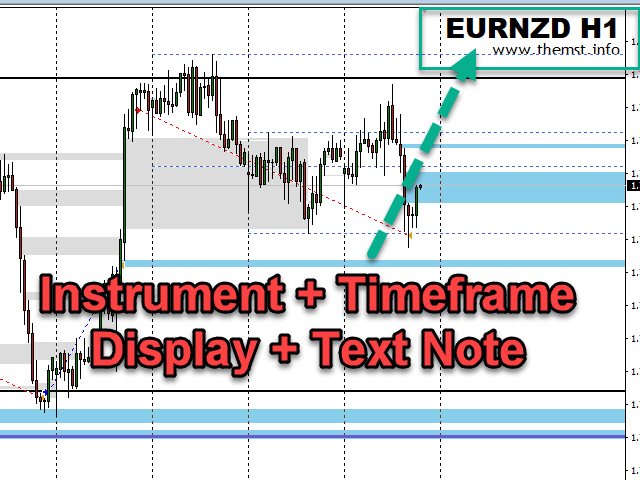
Display The Instrument & Timeframe On Your Chart
Show the symbol and timeframe on the chart of the instrument you are trading, this is useful for future analysis of your trades if taking screenshots, so you can easily identify what was being traded and the time frame for analysis.
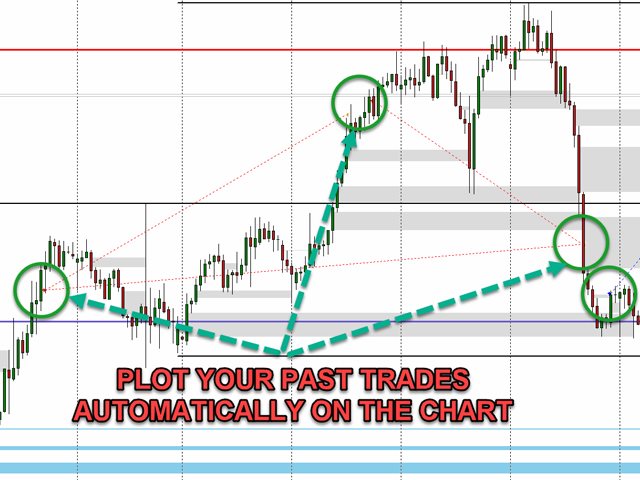
Display Trade History On Your Chart
Automatically plot your past trades plotted on your chart, so you can analyse past performance and see how good your entries and exits were to help you improve.
Show Your Breakeven or Average Price Level + Pips in Profit
This feature is useful for traders that scale into and out of positions with multiple trades. The breakeven line plots your average price for long and short positions separately. If you are Dollar cost averaging while you trade, hedging or using a martingale style entry method, you can instantly see where you will be back to break even on your trades. The amount of pips your trades are in either profit or drawdown is also displayed on the chart, so you can see your positions in pips too.
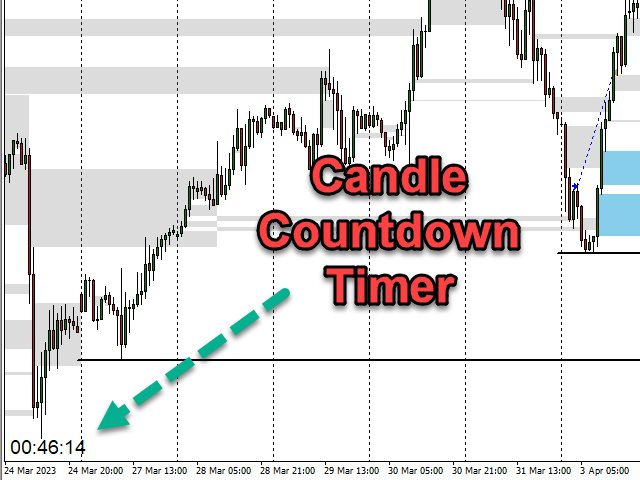
Candle Countdown Timer
Displays the amount of time left before the current candle closes on the time frame you are looking at on your chart. Very useful for scalpers or those that only enter trades when a candle has closed, so you can easily see when the next signal may occur.

















Very useful indicator, the best part is Lee uses the Indicator in his daily live sessions which helps tremendously. Thanks