ZigZag Robex
- Indicators
- Robert Sadamon
- Version: 1.0
- Activations: 20
Intelligent ZigZag indicator.
It has only two settings. The higher the values, the more significant extreme values it shows.
Application area.
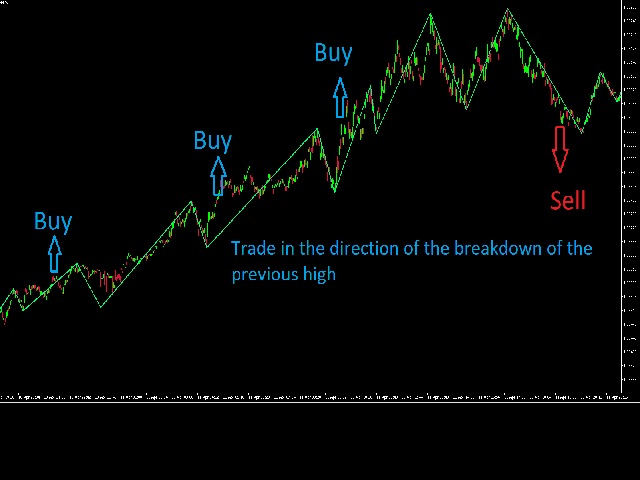
To determine the trend. Line drawing direction.
To recognize multiple patterns.
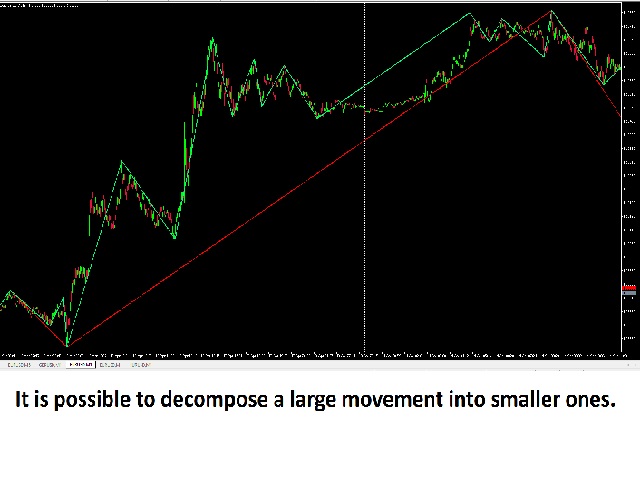
If you put two indicators on one chart with fast and slow values. By changing the color of one of them, you can very well decompose the price movement into waves.
The indicator can be a great helper for marking the chart and identifying the key levels from which the price reversed.