• Overview
  • Reviews (4)
  • Comments (3)
  • What's new

Real Spinning Top Candlestick

5

Real Spinning Top Indicator 

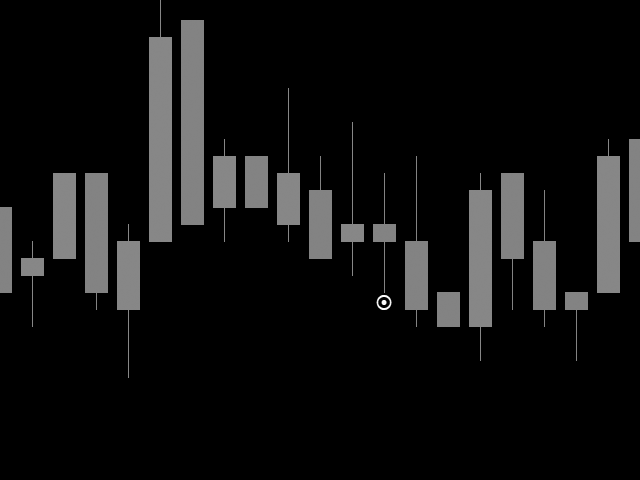
It detects accurate spinning top on chart with balanced body and wick height ratio which is the true meaning of spinning top which differs it from Hammers and Doji or Null Candlestick.

This indicator plots an wingdings icon at number of spinning tops found on the chart.

Settings include

Number of Bars : To adjust search on number of bars

Color of Icon :change color of icon

Icon code : change code of wingdings for icon

Reviews 4
zeejunaid
44
zeejunaid 2024.07.08 16:19 
 

An excellent indicator for either reversal or break out. A large profit can be made using l investment through this indicator.

Mao Le
21
Mao Le 2024.05.29 07:59 
 

It is really strong indicator. It's help me a lot in trading. Thank you for your hard working.

Passakon Ekaburudkul
284
Passakon Ekaburudkul 2024.01.08 11:44 
 

I really like it when use in H1 or over.

Recommended products
True Volatility
Cristian Eriksson
5 (1)
ATR is an excellent indicator to visualize if volatility is increasing or decreasing. But what if you want to compare the volatility to another pair or instrument? Since each pair with different quote currency has different pip value, the output of the ATR doesn't really say that much. Comparing pairs to other instruments is even harder.  What you as a trader care about is how much the pair has moved up or down in percentage, therefore normalizing ATR to percent would make things much easier.  T
FREE
Value Chart Candlesticks
Flavio Javier Jarabeck
4.7 (10)
The idea of a Value Chart indicator was presented in the very good book I read back in 2020 , " Dynamic Trading Indicators: Winning with Value Charts and Price Action Profile ", from the authors Mark Helweg and David Stendahl. The idea is simple and the result is pure genius: Present candlestick Price analysis in a detrended way! HOW TO READ THIS INDICATOR Look for Overbought and Oversold levels. Of course, you will need to test the settings a lot to find the "correct" one for your approach.
FREE
SSACD - Singular Spectrum Average Convergence/Divergence This is an analogue of the MACD indicator based on the Caterpillar-SSA ( Singular Spectrum Analysis ) method. Limited version of the SSACD Forecast indicator. Limitations include the set of parameters and their range. Specificity of the method The Caterpillar-SSA is an effective method to handle non-stationary time series with unknown internal structure. The method allows to find the previously unknown periodicities of the series and mak
FREE
Zona de Consolidacao
Edilson Domingos
5 (1)
It makes it easier to see where there have been consolidation zones for previous prices and allows you to highlight the histogram where there is the biggest consolidation zone. Input parameters Intervalo de preço Is the price between the histograms Periodo Number of candle sticks to be analyzed Porcentagem Highlights the histogram where there is minimal consolidation in relation to the analyzed period
FREE
Multi-timeframe trend indicator, based on the ADX / ADXWilder indicator The indicator shows trend areas using ADX or ADXWilder indicator data from multiple timeframes. The impulse mode of the indicator allows you to catch the beginning of a trend, and several "Screens" with different timeframes allow you to filter out market noise. How the indicator works: if PDI is greater than NDI, then it`s bullish movement; if PDI is less than NDI, then it`s bearish movement; to determine any trend, it
FREE
FRB Support and Resistance
Fernando Baratieri
5 (2)
FRB Trader - Our mission is to provide the best support to customers through conted and tools so that they can achieve the expected results FRB Support and Resistance - Indicator places lines on the chart to show Support and Resistance regions. - You can choose the timeframe you want to calculate, as well as the colors of the lines. - Algorithm calculates the points where the strengths of the asset are considered and are extremely important for decision making.
FREE
VWAP Indicator
LUC JACOBUS A VERHEECKE
4.32 (25)
Volume Weighted Average Price (VWAP) The volume weighted average price (VWAP) is a  trading   benchmark  used by traders that gives the average price a security has traded at throughout the day, based on both volume and price. It is important because it provides traders with insight into both the trend and value of a security. This indicator VWAP V2 is free and is the manual version of the extended Easy VWAP indicator (30 Euro), where the date and time properties are automatically entered. With
FREE
Weis Waves
Flavio Javier Jarabeck
3.15 (26)
The original author is David Weis, an expert in the Wyckoff Method. The Weis Wave is a modern adaptation of the 1930's Wyckoff Method, another expert in Tape Reading techniques and Chart Analysis. Weis Waves takes market volume and stacks it into waves according to price conditions giving the trader valuable insights about the market conditions. If you want to learn more about this subject you can find tons of videos in YouTube. Just look for "The Wickoff Method", "Weis Wave" and "Volume Spread
FREE
White Weis Volume Ticks
Ricardo Almeida Branco
5 (3)
White Weis Volume This indicator shows the sum of the volume in each wave, bulish or bearish, as idealized by David Weis , but it brings an important addition , which is the marking of the bar with the highest volume of the wave (White Bar)! In coding the indicator, it was sought to optimize the code to require minimal processing during use and not to overload mt5. The indicator can be used for pre-trading analysis and study, where the trader analyzes possible points of support and resi
Follow The Line MT5
Oliver Gideon Amofa Appiah
4.42 (31)
This indicator obeys the popular maxim that: "THE TREND IS YOUR FRIEND" It paints a GREEN line for BUY and also paints a RED line for SELL. (you can change the colors). It gives alarms and alerts of all kinds. IT DOES NOT REPAINT and can be used for all currency pairs and timeframes. Yes, as easy and simple as that. Even a newbie can use it to make great and reliable trades. NB: For best results, get my other premium indicators for more powerful and reliable signals. Get them here: https://www.m
FREE
Supports And Resistances Lines
Francisco Gomes Da Silva
4.76 (41)
Support and Resistance zones Indicator MT5 this indicator knows how to identify tops and bottoms automaticly. This support and resistance indicator creates support lines and resistance lines based on tops and bottoms. how to make support and resistance lines. this is an indicator to make automatic support and resistance lines. how to find support level with indicator. this indicator finds tops and bottoms automaticly. The Indicator automatically creates support lines every time “Fractals” create
FREE
Donchian Clouds
Samuel Manoel De Souza
The Indicator indicator draws 2 clouds based on Donchian Channels indicator values. The upper cloud is formed by the upper lines values and the lower cloud by the lowers lines values. The indicator allows to change the Channels parameters and the clouds colors the period of the base line and the multiplier of each Donchian Channels instance. The indicator holds 5 buffer index as follow: [0] - Outer values of the upper cloud [1]  - Inner values of the upper cloud [2]  - Base/Center line values [3
FREE
Bollinger Bands B
Flavio Javier Jarabeck
5 (3)
John Bollinger created this indicator in 2010 as a way to read the original indicator (Bollinger Bands) in a more "technical" way, shown as an oscillator. The typical range of the Bollinger Bands %B is 0 - 0.5 - 1.0, where "0" represents the lower band, the "0.5" the middle band, and "1" the upper band. The line on the indicator represents the Closing prices. As simple as that. SETTINGS Bollinger Bands period of analysis Standard Deviation multiplier Shift Price type to be analyzed If you
FREE
Spike Catch Pro
Amani Fungo
4 (6)
Spike Catch Pro 22:03 release updates Advanced engine for searching trade entries in all Boom and Crash pairs (300,500 and 1000) Programmed strategies improvements Mx_Spikes (to combine Mxd,Mxc and Mxe), Tx_Spikes,   RegularSpikes,   Litho_System,   Dx_System,   Md_System,   MaCross,   Omx_Entry(OP),  Atx1_Spikes(OP),   Oxc_Retracement (AT),M_PullBack(AT) we have added an arrow on strategy identification, this will help also in the visual manual backtesting of the included strategies and see h
FREE
Free automatic Fibonacci is an indicator that automatically plots a Fibonacci retracement based on the number of bars you select on the BarsToScan setting in the indicator. The Fibonacci is automatically updated in real time as new highest and lowest values appears amongst the selected bars. You can select which level values to be displayed in the indicator settings. You can also select the color of the levels thus enabling the trader to be able to attach the indicator several times with differe
FREE
Bar Color Trend
Germano Chagas
4.5 (10)
Combining the best of Price Action , Directional Movement , and Divergence/Convergence analysis, Candle Color Trend is a easy and reliable way to identify trend direction. The indicator automatically paints the candles according to the assumption that an uptrend is defined by prices that form a series of higher highs and higher lows. In contrast, a downtrend is defined by prices that form a series of lower highs and lower lows. Additionally, ADX Wilder indicator is used to measure trend weakness
FREE
Trend MACD Candles
Claus Dietrich
4 (2)
COLORED TREND MA / MACD CANDLES draw MA Candles above/below Moving Average draw MACD Candles above and below 0 and Signal-Line Your  Advantage: a simple view of the trend direction a simple view over the higher trend direction a calmer chart for the eye clear rules can be defined Settings: Value Quick-Set : pre-Settings MACD 3 / 9 / 6 MACD customize MA Candles Fast EMA : 12 Slow EMA : 26 MACD SMA : 9 1. MA Period : default 14 and 20, which are my favorite for all timeframes, I believe in the 1
FREE
This is  RSI with alarm and push notification  -is a indicator based on the popular Relative Strength Index (RSI) indicator with Moving Average and you can use it in Forex, Crypto, Traditional, Indices, Commodities. You can change colors to see how it fits you. Back test it, and find what works best for you. This product is an oscillator with dynamic overbought and oversold levels, while in the standard RSI, these levels are static and do not change. This allows  RSI with alarm and push notific
FREE
Are you tired of drawing trendlines every time you're analyzing charts? Or perhaps you would like more consistency in your technical analysis. Then this is for you. This indicator will draw trend lines automatically when dropped on a chart. How it works Works similar to standard deviation channel found on mt4 and mt5. It has 2 parameters: 1. Starting Bar 2. Number of bars for calculation The   starting bar   is the bar which drawing of the trend lines will begin, while the   number of bars for c
FREE
VWAP and MVWAP
Flavio Javier Jarabeck
4.17 (6)
Volume Weighted Average Price (VWAP) is a trading benchmark commonly used by Big Players that gives the average price a Symbol has traded throughout the day. It is based on both Volume and price. Additionally we put in this indicator the MVWAP (Moving Volume Weighted Average Price). For those who do not know the usage and the importance od this indicator I recommend a great article about this subject at Investopedia ( https://www.investopedia.com/articles/trading/11/trading-with-vwap-mvwap.asp )
FREE
Mitimom
Danil Poletavkin
The indicator is based on Robert Miner's methodology described in his book "High probability trading strategies" and displays signals along with momentum of 2 timeframes. A Stochastic oscillator is used as a momentum indicator. The settings speak for themselves period_1 is the current timeframe, 'current' period_2 is indicated - the senior timeframe is 4 or 5 times larger than the current one. For example, if the current one is 5 minutes, then the older one will be 20 minutes The rest of the
FREE
Money Flow Index EA Friendly
Flavio Javier Jarabeck
4.25 (4)
The traditional Money Flow Index indicator, this time, EA friendly . There are 3 buffers exposed that can be used by EAs to automatically analyze the Overbought and Oversold conditions of the quote. Just use the traditional iCustom() function to get these signals. This Money Flow Index calculation is based on the traditional Metaquote's MFI indicator. SETTINGS MFI Period Volume type to analyze (Real Volume or Ticks) Starting Overbought region Starting Oversold region USING WITH EAs Buffer
FREE
Donchian Pro
Paulo Henrique Faquineli Garcia
5 (2)
The Donchian Channel Channels are among the most popular tools of technical analysis, as they visually convey to the analyst the limits within which most price movement tends to occur. Channel users know that valuable information can be obtained at any time, whether prices are in the central region of a band or close to one of the border lines. One of the best known techniques to explore these concepts is Bollinger Bands. However, John Bollinger was not the only one to research the applicatio
FREE
Cybertrade Keltner Channels
Emanuel Andriato
4.75 (4)
Cybertrade Keltner Channels - MT5 Created by Chester Keltner, this is a volatility indicator used by technical analysis. It is possible to follow the trend of financial asset prices and generate support and resistance patterns. In addition, envelopes are a way of tracking volatility in order to identify opportunities to buy and sell these assets. It works on periods longer than the period visible on the chart. All values ​​are available in the form of buffers to simplify possible automations.
FREE
The Moving Average Convergence Divergence (MACD) trading strategy is a popular technical analysis tool that is used to identify changes in momentum and trend direction. The MACD is calculated by subtracting the 26-period exponential moving average (EMA) from the 12-period EMA. A 9-period EMA, called the "signal line," is then plotted on top of the MACD to act as a trigger for buy and sell signals. The MACD is considered to be in bullish territory when the MACD line is above the signal line an
FREE
Multi-timeframe trend indicator based on the ADX / ADXWilder indicator with Fibonacci levels The indicator shows trend areas using ADX or ADXWilder indicator data from multiple timeframes. The impulse mode of the indicator allows you to catch the beginning of a trend, and several "Screens" with different timeframes allow you to filter out market noise. Fibonacci levels are added to the price chart, which have flexible settings. How the indicator works: if PDI is greater than NDI, then   it`
FREE
SSA Stochastic Limited Edition
Roman Korotchenko
4.25 (4)
An analogue of the Stochastic oscillator based on algorithms of singular spectrum analysis (SSA) SSA is an effective method to handle non-stationary time series with unknown internal structure. It is used for determining the main components (trend, seasonal and wave fluctuations), smoothing and noise reduction. The method allows finding previously unknown series periods and make forecasts on the basis of the detected periodic patterns. Indicator signals are identical to signals of the original i
FREE
This indicator sums up the difference between the sells aggression and the buys aggression that occurred in each Candle, graphically plotting the waves of accumulation of the aggression volumes.   Through these waves an exponential average is calculated that indicates the direction of the business flow. Note: This indicator DOES NOT WORK for Brokers and/or Markets WITHOUT the type of aggression (BUY or SELL).   Be sure to try our Professional version with configurable features and alerts:  Agr
FREE
Tushar Chande Aroon
Flavio Javier Jarabeck
3.75 (4)
The name Aroon means “ Dawn's Early Light ” in Sanskrit. His creator Tushar Chande chose this name because the indicator is designed to catch the beginning of a new trend. At first sight it seems a little confusing all those jagged lines but after you understand the basics of it, you will find this indicator pretty cool and use it in a variety of ways, i.e.: Trigger, Trend Filtering System, and so on. The Aroon indicator was created in 1995 so it is a "modern" indicator compared to the Jurassic
FREE
Buyers of this product also purchase
Atomic Analyst MT5
Issam Kassas
4.79 (19)
First of all Its worth emphasizing here that this Trading Indicator is   Non-Repainting   , Non Redrawing and Non Lagging Indicator   Indicator, Which makes it ideal from both manual and robot trading.  User manual: settings, inputs and strategy . The Atomic Analyst  is a PA Price Action Indicator that uses Strength and Momentum of the price to find a better edge in the market. Equipped with Advanced filters which help remove noises and false signals, and Increase Trading Potential. Using Mult
Atbot
Zaha Feiz
4.96 (28)
ATbot : How It Works and How to Use It How It Works The "AtBot" indicator for the MT5 platform generates buy and sell signals using a combination of technical analysis tools. It integrates Simple Moving Average (SMA), Exponential Moving Average (EMA), and the Average True Range (ATR) index to identify trading opportunities. Additionally, it can utilize Heikin Ashi candles to enhance signal accuracy. MQL Channel    Leave a massage after purchase and receive a special bonus gift. 2 copies left for
First of all Its worth emphasizing here that this Trading System is Non-Repainting   , Non Redrawing and Non Lagging Indicator Which makes it ideal from both manual and robot trading .  Online course, manual and download presets. The Smart Trend Trading System MT5 is a comprehensive trading solution tailored for new and experienced traders . It combines over 10 premium indicators and features more than 7 robust trading strategies , making it a versatile choice for diverse market conditions . Tre
Gold Stuff mt5
Vasiliy Strukov
4.9 (185)
Gold Stuff mt5 is a trend indicator designed specifically for gold and can also be used on any financial instrument. The indicator does not redraw and does not lag. Recommended time frame H1. Contact me immediately after the purchase to get   personal bonus!  You can get a free copy of our Strong Support and Trend Scanner indicator, please pm. me! Settings  and manual   here   SETTINGS Draw Arrow - on off. drawing arrows on the chart. Alerts -   on off audible alerts. E-mail notification - on of
TPSproTREND PrO MT5
Roman Podpora
4.89 (9)
TPSpro TREND PRO  - is a trend indicator that automatically analyzes the market and provides information about the trend and each of its changes, as well as giving signals for entering trades without redrawing! The indicator uses each candle, analyzing them separately. referring to different impulses - up or down impulse. Exact entry points into transactions for currencies, crypto, metals, stocks, indices!  Version MT4               DETAILED DESCRIPTION               R ecommended to use with an
TPSpro RFI Levels MT5
Roman Podpora
4.67 (9)
Reversal First Impulse levels (RFI)      INSTRUCTIONS        RUS       -       ENG              R ecommended to use with an indicator   -   TPSpro  TREND PRO -  Version MT4                 A key element in trading is zones or levels from which decisions to buy or sell a trading instrument are made. Despite attempts by major players to conceal their presence in the market, they inevitably leave traces. Our task was to learn how to identify these traces and interpret them correctly. Main functi
Top indicator for MT5   providing accurate signals to enter a trade without repainting! It can be applied to any financial assets:   forex, cryptocurrencies, metals, stocks, indices .  Watch  the video  (6:22) with an example of processing only one signal that paid off the indicator! MT4 version is here It will provide pretty accurate trading signals and tell you when it's best to open a trade and close it. Most traders improve their trading results during the first trading week with the help of
First of all Its worth emphasizing here that this Trading Tool is Non Repainting , Non Redrawing and Non Lagging Indicator , Which makes it ideal for professional trading . Online course, user manual and demo. The Smart Price Action Concepts Indicator is a very powerful tool for both new and experienced traders . It packs more than 20 useful indicators into one , combining advanced trading ideas like Inner Circle Trader Analysis and Smart Money Concepts Trading Strategies . This indicator focus
Quantum Trend Sniper
Bogdan Ion Puscasu
4.92 (48)
Introducing   Quantum Trend Sniper Indicator , the groundbreaking MQL5 Indicator that's transforming the way you identify and trade trend reversals! Developed by a team of experienced traders with trading experience of over 13 years,   Quantum Trend Sniper Indicator   is designed to propel your trading journey to new heights with its innovative way of identifying trend reversals with extremely high accuracy. ***Buy Quantum Trend Sniper Indicator and you could get Quantum Breakout Indicator fo
Trend Screener Pro MT5
STE S.S.COMPANY
4.88 (67)
Unlock the Power of Trends Trading with the Trend Screener Indicator: Your Ultimate Trend Trading Solution powered by Fuzzy Logic and Multi-Currencies System! Elevate your trading game with the Trend Screener, the revolutionary trend indicator designed to transform your Metatrader into a powerful Trend Analyzer. This comprehensive tool leverages fuzzy logic and integrates over 13 premium features and three trading strategies, offering unmatched precision and versatility. LIMITED TIME OFFER : Sup
FX Power MT5 NG
Daniel Stein
5 (6)
Trading GOLD, and currencies, with the dog walk strategy  - super smart Trading GOLD, and currencies, with the breakout strategy  - super easy Visit our all-new   Stein Investments Welcome Page   to get the latest information, updates and trading strategies. FX Power MT5 NG  is the next generation of our long-time very popular currency strength meter, FX Power.  And what does this next-generation strength meter offer? Everything you have loved about the original FX Power  PLUS GOLD/XAU st
FX Volume MT5
Daniel Stein
4.94 (17)
Visit our all-new   Stein Investments Welcome Page   to get the latest information, updates and trading strategies. FX Volume is the FIRST and ONLY volume indicator that provides a REAL insight into the market sentiment from a broker's point of view. It provides awesome insights into how institutional market participants, like brokers, are positioned in the Forex market, much faster than COT reports. Seeing this information directly on your chart is the real game-changer and breakthrough solut
IX Power MT5
Daniel Stein
4.17 (6)
IX Power   finally brings the unbeatable precision of FX Power to all your trading symbols. It accurately determines the intensity of short, medium and long-term trends in your favourite indices, stocks, commodities, ETFs, and even cryptocurrencies. You can   analyse everything   your terminal has to offer. Try it out and experience how   your timing improves significantly   when trading. Read about our latest strategic development -  Easy scalping with IX Power Visit our all-new   Stein Inve
XQ Indicator MetaTrader 5
Marzena Maria Szmit
3.5 (2)
Step into the realm of Forex trading with confidence and precision using XQ, a cutting-edge Forex indicator designed to elevate your trading game to unprecedented heights. Whether you're a seasoned trader or just stepping into the world of currency exchange, XQ Forex Indicator empowers you with the insights and signals needed to make informed trading decisions. The signal conditions are a combination of three indicators, and XQ Forex Indicator only display  medium and long-term trends . The ind
Easy By Sell is a market indicator for opening and closing positions. It becomes easy to track market entries with alerts. It indicates trend reversal points when a price reaches extreme values ​​and the most favorable time to enter the market. it is as effective as a Fibonacci to find a level but it uses different tools such as an algorithm based on ATR indicators and Stochastic Oscillator. You can modify these two parameters as you wish to adapt the settings to the desired period. My othe
This dashboard shows the latest available   harmonic patterns   for the selected symbols, so you will save time and be more efficient /   MT4 version . Free Indicator:   Basic Harmonic Pattern Indicator columns Symbol:  the selected symbols will appear Trend:   bullish or bearish Pattern:  type of pattern (gartley, butterfly, bat, crab, shark, cypher or ABCD) Entry:  entry price SL:  stop loss price TP1:   1st take profit price TP2:  2nd take profit price TP3:  3rd take profit price Current
TrendMaestro5
Stefano Frisetti
note: this indicator is for METATRADER4, if you want the version for METATRADER5 this is the link:  https://www.mql5.com/it/market/product/108106 TRENDMAESTRO ver 2.4 TRENDMAESTRO recognizes a new TREND in the bud, he never makes mistakes. The certainty of identifying a new TREND is priceless. DESCRIPTION TRENDMAESTRO identifies a new TREND in the bud, this indicator examines the volatility, volumes and momentum to identify the moment in which there is an explosion of one or more of these data a
Golden Spikes Premium
Kwaku Bondzie Ghartey
Golden Spikes Detector Overview: The Golden Spikes Premium is a groundbreaking trading indicator meticulously crafted for the Boom and Crash indices on the Deriv market. Tailored to meet the needs of discerning traders, this powerful tool operates exclusively on the one-minute timeframe, providing timely and precise signals to maximize your trading potential. The Golden Spikes Detector stands out in its ability to deliver accurate signals, ensuring that you capitalize on market opportunities wit
Gartley Hunter Multi
Siarhei Vashchylka
5 (8)
Gartley Hunter Multi - An indicator for searching for harmonic patterns simultaneously on dozens of trading instruments and on all possible timeframes. Manual (Be sure to read before purchasing) | Version for MT4 Advantages 1. Patterns: Gartley, Butterfly, Shark, Crab. Bat, Alternate Bat, Deep Crab, Cypher 2. Simultaneous search for patterns on dozens of trading instruments and on all possible timeframes 3. Search for patterns of all possible sizes. From the smallest to the largest 4. A
PZ Support Resistance MT5
PZ TRADING SLU
4.17 (6)
Unlock key market insights with automated support and resistance lines Special Offer: Purchase now to receive free bonuses worth $89! (Read more for details) Tired of plotting support and resistance lines? This is a multi-timeframe indicator that detects and plots supports and resistance lines in the chart with the same precision as a human eye would. As price levels are tested over time and its importance increases, the lines become thicker and darker, making price leves easy to glance and ev
Matrix Arrow Indicator MT5
Juvenille Emperor Limited
5 (14)
Matrix Arrow Indicator MT5  is a unique 10 in 1 trend following   100% non-repainting  multi-timeframe indicator that can be used on all symbols/instruments:   forex,   commodities,   cryptocurrencies,   indices,   stocks .  Matrix Arrow Indicator MT5  will determine the current trend at its early stages, gathering information and data from up to 10 standard indicators, which are: Average Directional Movement Index (ADX) Commodity Channel Index (CCI) Classic Heiken Ashi candles Moving Aver
Volume by Price MT5
Brian Collard
3.6 (5)
The Volumebyprice.com Indicator for MetaTrader 5 features Volume Profile and Market Profile TPO (Time Price Opportunity). Volume and TPO histogram bar and line charts. Volume Footprint charts. TPO letter and block marker collapsed and split structure charts. Static, dynamic and flexible range segmentation and compositing methods with relative and absolute visualizations. Session hours filtering and segment concatenation with Market Watch and custom user specifications. Graphical layering, posit
ICT, SMC, SMART MONEY CONCEPTS, SMART MONEY, Smart Money Concept, Support and Resistance, Trend Analysis, Price Action, Market Structure, Order Blocks, BOS/CHoCH,   Breaker Blocks ,  Momentum Shift,   Supply&Demand Zone/Order Blocks , Strong Imbalance, HH/LL/HL/LH,    Fair Value Gap, FVG, Invert FVG, IFVG,  Premium  &   Discount   Zones, Fibonacci Retracement, OTE, Buy Side Liquidity, Sell Side Liquidity, BSL/SSL Taken, Equal Highs & Lows, MTF Dashboard, Multiple Time Frame, BigBar, HTF OB, HTF
Volatility Trend System - a trading system that gives signals for entries. The volatility system gives linear and point signals in the direction of the trend, as well as signals to exit it, without redrawing and delays. The trend indicator monitors the direction of the medium-term trend, shows the direction and its change. The signal indicator is based on changes in volatility and shows market entries. The indicator is equipped with several types of alerts. Can be applied to various trading in
Blahtech Supply Demand MT5
Blahtech Limited
4.54 (13)
Was: $299  Now: $99   Supply Demand uses previous price action to identify potential imbalances between buyers and sellers. The key is to identify the better odds zones, not just the untouched ones. Blahtech Supply Demand indicator delivers functionality previously unavailable on any trading platform. This 4-in-1 indicator not only highlights the higher probability zones using a multi-criteria strength engine, but also combines it with multi-timeframe trend analysis, previously confirmed swings
Gold TMAF MTF  - this is a best stock technical indicator. The indicator algorithm analyzes the price movement of an asset and reflects volatility and potential entry zones. The best indicator signals: For SELL = red upper boundary of TMA2 above the red upper boundary of TMA1 + red fractal indicator above + yellow SR signal arrow in the same direction. For BUY = blue lower boundary of TMA2 below the blue lower boundary of TMA1 + blue fractal indicator from below + aqua SR signal arrow in the s
Automated Trendlines MT5
Georgios Kalomoiropoulos
Trendlines  are the most essential tool of technical analysis in forex trading.  Unfortunately, most  traders don’t draw them correctly. Automated Trendlines indicator is a professional tool for serious traders that help you visualize the trending movement of the markets . AMAZING OFFER --> Activations from 5 to 20 for "MTF Supply Demand Zones" and "Automated Trendlines" There are two types of Trendlines Bullish Trendlines and Bearish Trendlines. In the uptrend, Forex trend line is drawn th
TPA True Price Action indicator reveals the true price action of the market makers through 100% non-repainting signals strictly at the close of a candle! TPA shows entries and re-entries, every time the bulls are definitely stronger than the bears and vice versa. Not to confuse with red/green candles. The shift of power gets confirmed at the earliest stage and is ONE exit strategy of several. There are available now two free parts of the TPA User Guide for our customers. The first "The Basics"
** All Symbols x All Timeframes scan just by pressing scanner button ** ***Contact me after purchase to send you instructions and add you in "123 scanner group" for sharing or seeing experiences with other users. After 17 years of experience in the markets and programming, Winner indicator is ready. I would like to share with you! Introduction The 123 Pattern Scanner indicator with a special enhanced algorithm is a very repetitive common pattern finder with a high success rate . Interestingly,
Auto Order Block with break of structure based on ICT and Smart Money Concepts (SMC) Futures Break of Structure ( BoS )             Order block ( OB )            Higher time frame Order block / Point of Interest ( POI )    shown on current chart           Fair value Gap ( FVG ) / Imbalance   -  MTF      ( Multi Time Frame )    HH/LL/HL/LH  -  MTF      ( Multi Time Frame )  Choch  MTF      ( Multi Time Frame )  Volume Imbalance     ,  MTF          vIMB Gap’s Power of 3 Equal High
More from author
This indicator plots upto 6 levels which can be enable / disable to make chart cleaner as per trader's requirement These 6 levels are in 2 sets : High and Low For each sets, different timeframe can be selected It is based on strategy of Previous High Low reversal, as its considered that price usually show rejection in smaller timeframe like 5min when price reach Daily, Weekly or Monthly High Low Features : - Track upto 6 Timeframe High Lows in single chart - Set alerts on these levels, Mail, Pus
Crypto Ticks and Depth
Rajesh Kumar Nait
5 (1)
Cryptocurrency Live Tick Data Bid and Ask and Book Depth for EA Available Exchange : 1. Binance Spot (Supports Order Book Depth on active chart window) realtime Tick Data and Futures (Supports multiple Order Book Depth ) realtime Tick Data 2. Kucoin Spot and Futures, Supports Order Book depth on active chart window 3. Bybit Futures and Inverse Futures Tick Data Bid Ask Last Upcoming Exchange : OKX, MEXC and more.. Features : 1. Live Tick Data with Bid and Ask info 2.  Best Bid ask and quantit
This indicator finds Double Top and Double bottom Example : What is Double Top When price establishes a new high and then falls, then reverse to the same candle area of High then its considered a valid double top and vice versa for double bottom. 1. It plots and high and low on visible chart if ChartChange is set to true else it searches on new bar opening 2. If there is double top and double bottom found in visible chart window then it plots a line 3. It has options to customize text color, te
FREE
Higher Time Frame Bars
Rajesh Kumar Nait
5 (1)
This indicator efficiently tracks any other timeframe candlesticks which you want to track on same chart 1. Select any higher time frame to load bars on same chart 2. Customize colors, width, background and style of candlesticks and wick width 3. Choose number of bars to draw candlesticks 4. Track higher timeframe complete candles along with wick and body 5. Easy and convenient for those who dont want to switch chart. 6. See candle range { high - low } and change color, font, size 7. Enable / D
Perfect Seconds chart indicator allows you to convert minute candles of live data into seconds 1. Choose any number of seconds to close a bar 100% with accurate time. 2. This is Live OHLC rates based data, It works even if ticks are not available. 3. No external DLL required, it works smoothly on VPS 4. Fast and optimized code 5. Supports Crypto Pairs such as BInance, Kucoin and all other exchanges where Futures live chart can be converted into seconds easily. 6. Support all type of symbols such
This library will allow you to manage trades using any of your EA and its very easy to integrate on any EA which you can do yourself with the script code which is mentioned in description and also demo examples on video which shows the complete process. This product allows trading operations via API For chart : Renting Crypto Charting for OHLC data or Crypto Ticks with Order Book Depth is optional If your EA is HFT and operations on seconds chart, You may be interested in converting charts to se
Binance Trading Tool for MT5 1. This product include live chart from websocket, historical chart, automatic updates on restart of mt5 terminal to make it run smooth with zero manual intervention that makes you experience to trade Binance smoothly. Trading, Live chart & Historical Data available for Spot and Futures How to use : 1. You need to add your API key and secret in Input field of this utility. When you create your API, make sure you enable Futures to trade Futures 3.  You
This library will allow you to manage trades using any of your EA and its very easy to integrate on any EA which you can do yourself with the script code which is mentioned in description and also demo examples on video which shows the complete process. This product allows trading operations via API and does not include charts. Users may use charts from brokers who provides Crypto and send orders to binance - Supports One way and Hedge Mode - Place Limit, SL Limit and Take Profit Limit Orders -
Crypto Charting
Rajesh Kumar Nait
5 (3)
Cryptocurrency Charts for MT5. Features : 1. Live OHLC Chart via Websocket (wss) 2. Update History of Bars from API. Available Mark Price, Index Price and Last price options in Binance Exchange 3. Auto Update history on charts when MT5 is restarted to make sure there is no missing data in Bars and is always kept up to dated like native chart 4. Scheduled History update from API : In case of there is internet disconnection for a millisecond, bar ohlc value may be incorrect as websocket is strea
Market structures are the one which when breakout in higher timeframe may help clears a trend to a trader. 1. This indicator will draw ZigZag to only last 2 structures (previous high and low of ZigZag ) and a new bar of ZigZag will be only formed when break of structure happens 2. It gives Terminal and Push notificationon break of structure 3. Increase and Decrease Extdepth of ZigZag from "[" and "]" keys to adjust swing 4. Change colors of Line AB BC and CD 5. Add to many charts and get alerts
This indicator allows you to show fibonacci levels labels with big font size . It supports up to 25 fibonacci levels - As soon as you draw fibonacci it shows the levels you added as input parameter with big font size with the color and font you choose. Customizable options : 1. Fibo Text Font 2. Fibo Text Size 3. Fibo Text Color 3. Add description to each level 4. Other options such as Anchors and Degrees
Multi Symbol Double Click anywhere on chart to set price alert for MT4 and get notified from Terminal Alert or Push Notification 1. Add the EA Utility on chart 2. Browse chart by <- left or -> right arrow keys 3. Double click anywhere on chart and it will add a line, drag this line to set your desired price and voila, alert is set! When price will reach to the line it will notify you with either terminal or push notification as per utility's settings.  This alert will keep working even if you r
This indicator plots upto 6 levels which can be enable / disable to make chart cleaner as per trader's requirement You can get alerts on Previous Week Previous Day, Previous Month or high low of any period previous candle available in MT4 These 6 levels are in 2 sets : High and Low For each sets, different time frame can be selected It is based on strategy of Previous High Low reversal, as its considered that price usually show rejection in smaller timeframe like 5min when price reach Daily, W
Cobra Pivot Points is an indicator for plotting best optimized pivot points support and resistance levels which you can backtest yourself by downloading the DEMO. 1. Select 7 type of Pivot Mode : Cobra, Camarilla 1, Camarilla 2, Floor, Woodie, Demark and Fibonacci pivots 2. You can use any time frame to find pivot points support and resistance 3. You can play with Previous day High Low Close value with Shift parameter. 1 = Previous Bar, 2 = Bar before Previous bar and so on.. These parameter w
Multi Currency Previous Candle or Previous Bar Scanner helps you scan multi symbol charts with any custom timeframe which you select from indicator settings. Based on product : https://www.mql5.com/en/market/product/110229 It can be used to scan multi symbols for Previous Day high low, Previous week high low, Previous month High low or any custom timeframe e.g. Previous 4 hour chart high low It filters noise and gives directional alerts when price touches High or low line  The strategy is sim
Pivot Points Multi Symbol Scanner scans all symbols available in marketwatch for Floor, Woodie, Camarilla, Demark or Fibonacci Pivot Points. You can select any timeframe to calculate pivot points and get alerts when price touch these levels of support and resistance. For visual Pivot Points You may be interested in this product : https://www.mql5.com/en/market/product/110231 It has options for choosing various alerts type You can choose and set frequency to scan in milliseconds 1000 me
Add this indicator to chart and set the ExtDepth Setting of ZigZag  It gives instant alert when Price touches trendline Upper, Lower or Middle channel Features : -Enable / Disable alerts on upper, lower or middle line - Add pause after a alert in seconds - Pause or Unpause Trend channel with button on chart - Add early alerts by adding points in input field, for example ETH price is 2900.25 here the digits 25 is "point", so if you add 25 in input field in points and if the value of lower l
Crypto to MT5
Rajesh Kumar Nait
Crypto.com to MT5 Live Candlestick Stream to Metatrader 5 from Crypto.com websocket Its a OHCLV (Open High Low Close Real Volume ) Live Rates Data you can check my other crypto product on my profile  https://www.mql5.com/en/users/rajeshnait/seller 1. OHLCV Data 2. Supports and Creates Multiple Symbols 3. You need to add Crypto.com websocket and api URL as mentioned at Tools > Options > Allow Webrequest from URL tab and also tick Allow Webrequest checkbox - Websocket URL : stream.crypto.com - API
Patterns Explorer for Triangle pattern such as symmetrical triangle, asymmetrical triangle or right angle triangle , Wedge pattern such as Rising wedge or Falling wedge, Expansion pattern and Trend Channel This indicator explores historical pattern as well as current patterns, It is the best indicator for those who are trying to save time from manually drawing trendline or triangle and want to use this for automated analysis of plotting best patterns on chart Features : - Panel for changing ZigZ
Kraken Crypto Exchange Futures History Update Panel Features : 1.  It will create symbol based on setting and update history fully which is available from Kraken API for the symbol. This panel updates history on Kraken Futures symbols with Open High Low Close data, It also Prints message when History Update is complete. Please note this is not LIVE Data.   3.  You need to add Kraken API URL as mentioned at Tools > Options > Allow Webrequest from URL tab and also tick Allow Webrequest checkbox
5 EMA Scalping Strategy Multi Symbol Scanner This EA utility will scan all symbols which are selected in marketwatch and alert when such condition is formed in chart when Candle low is above EMA 5 for Sell alert and Candle high is lower from EMA5 so you can be ready before selling or buying for scalping purpose on 5min chart For more details watch attached video Logic : When a candle closes above 5 EMA in 5 mins chart, Wait for its low to break and Sell when low is broken by wick, Your SL sh
Multi Symbol ZigZag Breakout Scanner scans all symbols selected in marketwatch. It will help finding double top, double bottom or any fibonacci extension level easily when price is about to reach those levels. You can select Timeframe, and multiple Extdepths (up to 3) of Zigzag. Recommended ZigZag are 21,34 and 55 which covers all types of Zigzag and filter noise You can set to receive either terminal alert or push notification or both Use cases : 1. To find Break of structure of order blocks
Fibo Musang FMBCR CB1 breakout multi symbol scanner for MT5 scans all symbols selected in marketwatch for dominan break Fibo Musang CB1 or Candle Break 1 is a strategy that works very well on Gold XAUUSD and other forex symbols. This scanner will help you scan mulltisymbol currencies very fast and get alerts on FMCBR CB1 breakout Please see video for more details as its completely customizable as per trader's preference: 1. You can select timeframe and History of Bars 2. You can modify your
Multi Symbol Double Click anywhere on chart to set price alert and get notified from Terminal Alert or Push Notification 1. Add the EA Utility on chart 2. Browse chart by <- left or -> right arrow keys 3. Double click anywhere on chart and it will add a line, drag this line to set your desired price and voila, alert is set! When price will reach to the line it will notify you with either terminal or push notification as per utility's settings.  This alert will keep working even if you restart te
Control Candle is the candlestick which holds multiple inside bars and are in control until its high low range is broken by close of any candlestick. When control candle is broken, price may act on these control candle as support and resistance. This indicator create rectangles on chart which will help you find control candles fast. Control candle indicator box is customizable by color, style, width and other options in indicator settings.
Cobra Levels
Rajesh Kumar Nait
Introducing Cobra Levels Watch the Tutorial video of backtest and accuracy : here This strategy is based on the concept that prices will revert to their mean or average value over time. Identify the mean price : Calculate the levels e.g. U4 U5 or D4 D5 Wait for the price to move away from the mean (Middle Line) before taking action. Buy and sell signals : Buy : When the price falls below the lower threshold. Sell : When the price rises above the upper threshold. These are 6 sets of lev
Cobra Pivot Points is an indicator for plotting best optimized pivot points support and resistance levels which you can backtest yourself by downloading the DEMO. 1. Select 7 type of Pivot Mode : Cobra, Camarilla 1, Camarilla 2, Floor, Woodie, Demark and Fibonacci pivots 2. You can use any time frame to find pivot points support and resistance 3. You can play with Previous day High Low Close value with Shift parameter. 1 = Previous Bar, 2 = Bar before Previous bar and so on.. These parameter w
Multi Currency Previous Candle or Previous Bar Scanner helps you scan multi symbol charts with any custom timeframe which you select from indicator settings. Based on product : https://www.mql5.com/en/market/product/78657 It can be used to scan multi symbols for Previous Day high low, Previous week high low, Previous month High low or any custom timeframe e.g. Previous 4 hour chart high low It filters noise and gives directional alerts when price touches High or low line  The strategy is simp
Pivot Points Multi Symbol Scanner scans all symbols available in marketwatch for Floor, Woodie, Camarilla, Demark or Fibonacci Pivot Points. You can select any timeframe to calculate pivot points and get alerts when price touch these levels of support and resistance. For visual Pivot Points You may be interested in this product : https://www.mql5.com/en/market/product/110072 It has options for choosing various alerts type You can choose and set frequency to scan in milliseconds 1000 me
Easy Fibonacci
Rajesh Kumar Nait
Easy Fibonacci is an indicator for MT5 which allows you to plot fibonacci retracement easily Features 1. up to 10 fibo levels can be set from indicator settings 2. Each level may have different line style, line color, line width and other settings customizable 3. You can use Mouse with Extra buttons to map V and B keys and conveniently plot fibonacci Button Actiions : B and V : Plot Top / Bottom fibonacci on visible area of chart N and M : Next and Previous Candles swing extensions R : Reset
Filter:
zeejunaid
44
zeejunaid 2024.07.08 16:19 
 

An excellent indicator for either reversal or break out. A large profit can be made using l investment through this indicator.

Mao Le
21
Mao Le 2024.05.29 07:59 
 

It is really strong indicator. It's help me a lot in trading. Thank you for your hard working.

Passakon Ekaburudkul
284
Passakon Ekaburudkul 2024.01.08 11:44 
 

I really like it when use in H1 or over.

Peter Pedro
68
Peter Pedro 2023.04.08 14:50 
 

super

Reply to review
Version 1.1 2024.01.08
added new logic in input to customize spinning top