Zen Fractal
- Indicators
- Xiaoyu Huang
- Version: 1.0
- Activations: 20
CZSC Fractal type index
Features:
Carried out a thorough processing of the inclusion relationship
It is convenient to use the EA call to judge whether it is a top-bottom classification, and the status in "Teaching You to Stock 93: The Relationship between the Two Tables and the Inside of the Trend Structure 2"
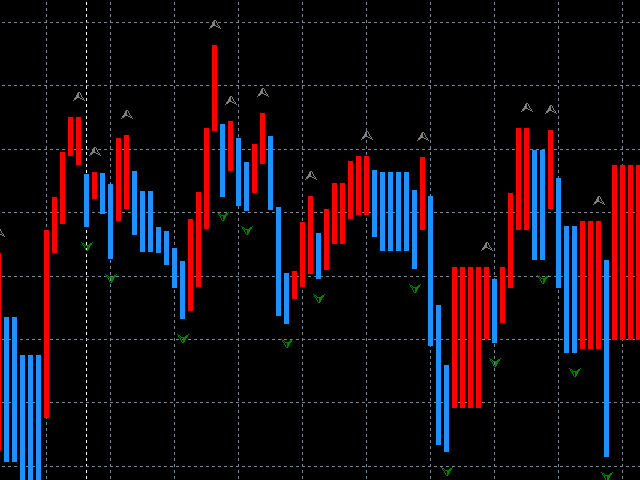
Show top-bottom classification with arrows
Show possible pens in different colors
The inclusion relationship of two adjacent K-lines gives a definition: the high and low points of a K-line are all within the range of its adjacent K-lines, then this K-line and its adjacent K-lines are the inclusion relationship
In the K-line chart, you often see some K-lines that have a relationship. The so-called inclusion processing is to combine two K-lines with inclusion relationship into one K-line.
Definition: Three consecutive K-lines that have been included and processed. If the high point of the middle K-line is the highest, then this combination is called the top type.
Definition: Three consecutive K-lines after inclusion processing, if the low point of the middle K-line is the lowest, then this combination is called the bottom type.
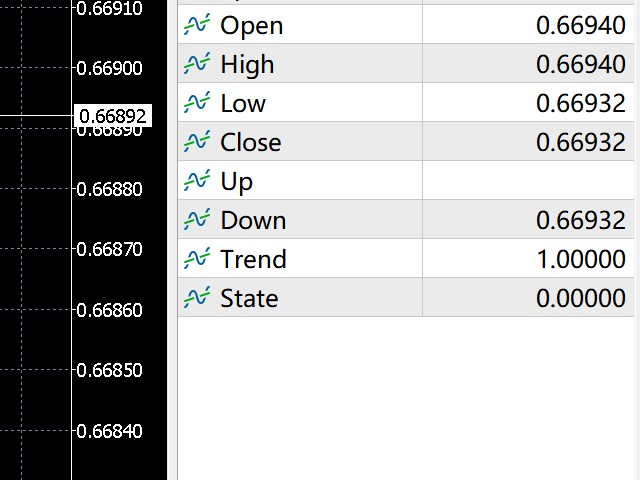
Array of indicators called by the EA:
0. Open the opening price of the K-line after the merger
1.High The combined high point
2.Low combined low
3.Close the closing price after the merger
4.Up top type
5.Down bottom type
6. Trend up or down (1, -1)
7. State marching (1, 0)
