MetaForecast M4
- Indicators
- Vahidreza Heidar Gholami
- Version: 1.6
- Updated: 21 September 2023
- Activations: 10
MetaForecast predicts and visualizes the future of any market based on the harmonics in price data. While the market is not always predictable, if there is a pattern in the price, MetaForecast can predict the future as accurately as possible. Compared to other similar products, Metaforecast can generate more accurate results by analyzing market trends.
Input Parameters
Past size
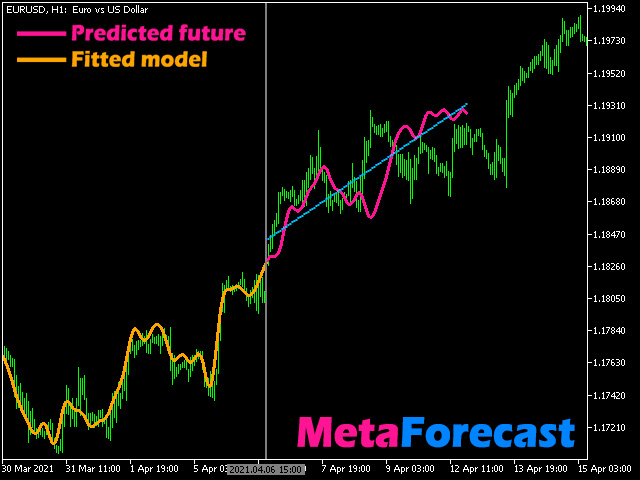
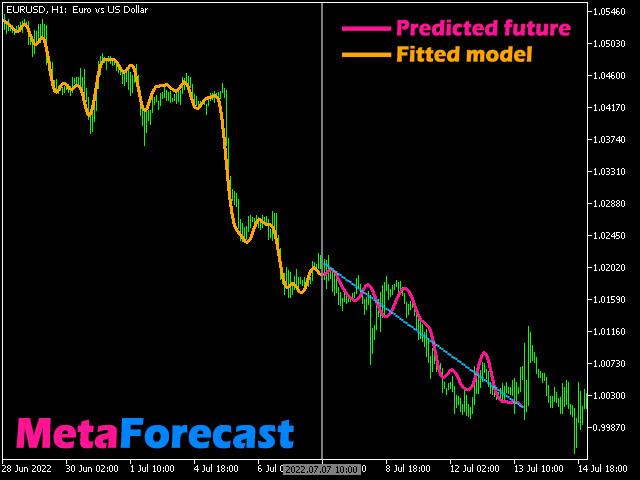
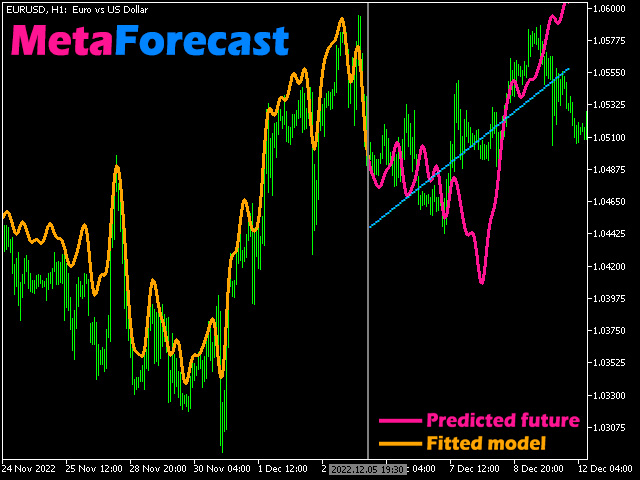
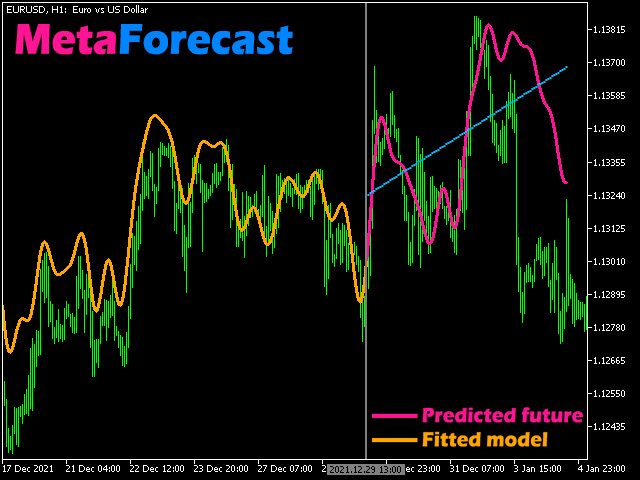
Specifies the number of bars that MetaForecast uses to create a model for generating future predictions. The model is represented by a yellow line drawn over the selected bars.
Future size
Specifies the number of future bars that should be predicted. The predicted future is shown by a pink line with blue regression lines drawn over it.
Degree
This input determines the level of analysis that MetaForecast will conduct on the market.
| Degree | Description |
|---|---|
| 0 | For degree 0, it is recommended to use a large value for the "Past size" input to cover all peaks and troughs and details in the price. |
| 1 | For degree 1, MetaForecast can understand trends and generate better results with a smaller "Past size". |
| 2 | For degree 2, in addition to trends, MetaForecast can also identify reversal points. For degrees greater than 1, higher values for the 'Details' and 'Noise Reduction' inputs must be used. |
| >2 | It is not recommended to use degrees greater than 2, but it can be tried. |
Details
Specifies the percentage of details in the price data that should be extracted for generating predictions. Higher values need higher processing time.
Noise Reduction
When using degrees greater than 1, MetaForecast needs noise reduction for the input data in order to create a proper model. For example, for degree=2, set the noise reduction to be 90%. To obtain a better result, increase the details to 20%.
Remove jumps
Sometimes, there are big jumps in the prediction results, especially for degrees higher than 1. Enabling this input can correct the shape of the prediction.
Regression lines
MetaForecast draws regression lines on the predicted bars to make the trend clearer. Use this input to specify the number of lines.
Calculate per n bars
Set the interval between two predictions using this input. For example, if you set it to 100, it means that it predicts the future and then pause for 100 bars before making the next prediction.
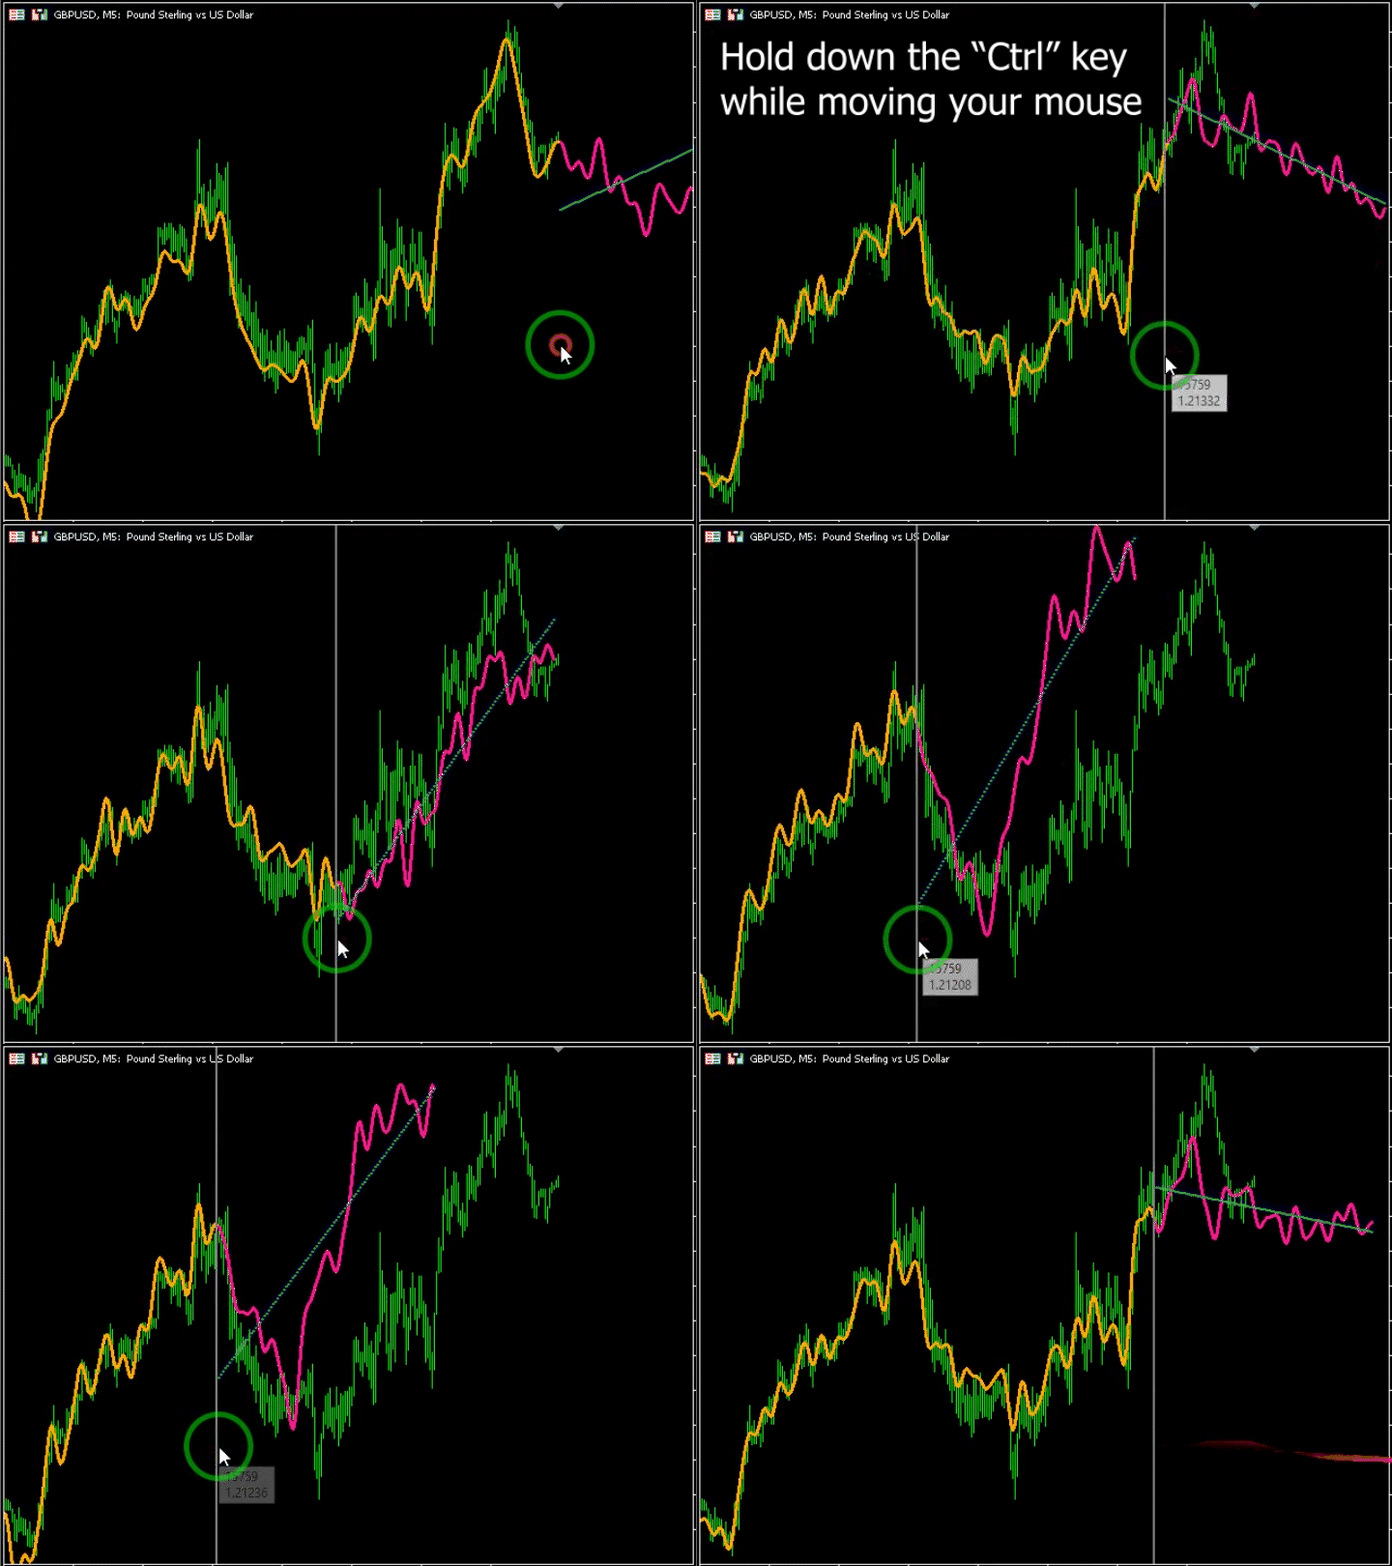
MetaForecast enables traders to predict future price movements in the price history, allowing them to compare the results with actual future prices. To use this feature, press "H" on your keyboard to see the vertical line, which can be moved to bring the prediction into historical prices, rather than the current candle. To navigate through history, hold down the "Ctrl" key and move your mouse to move the vertical line. To get back to the current candle press "H" again. If you have multiple MetaForecasts on your chart and need to reset them simultaneously, press the "R" key on your keyboard.
I'm always exploring new ideas to forecast the market's future. Whenever I discover a new working method or algorithm, I incorporate it into the product. I'd appreciate your support in allowing me to continue developing this unique offering.





There are definitely improvements to be made, but not bad for starters.