MACD Spectra
- Indicators
- Muhammad Faisal Sagala
- Version: 1.0
- Activations: 10
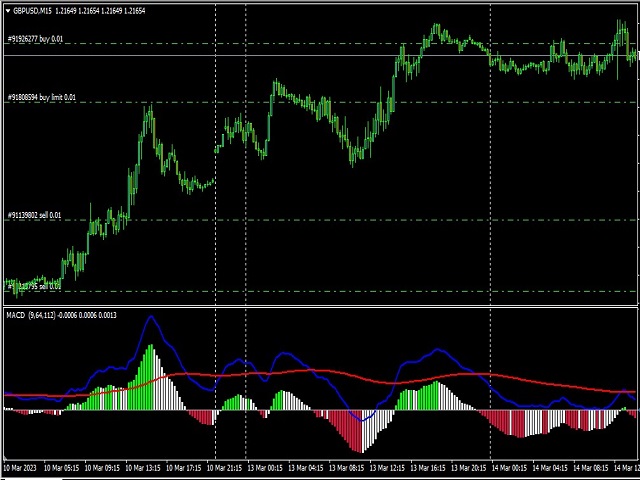
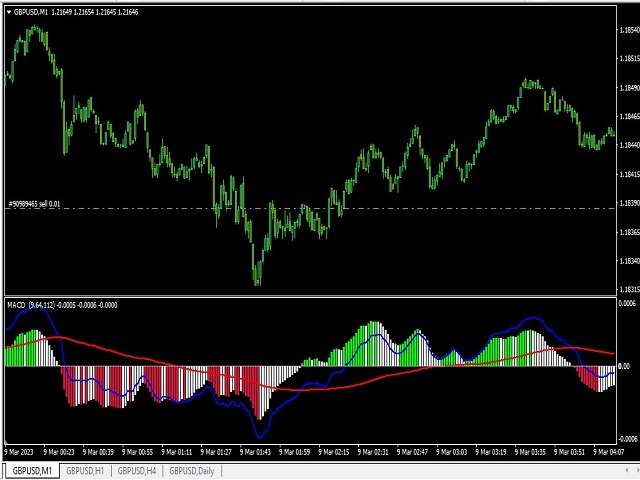
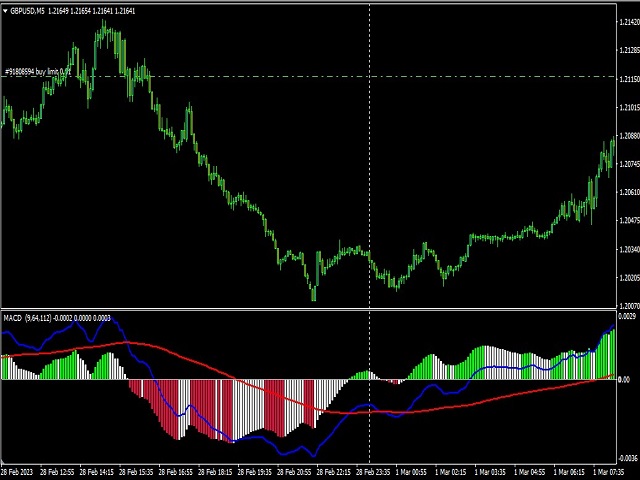
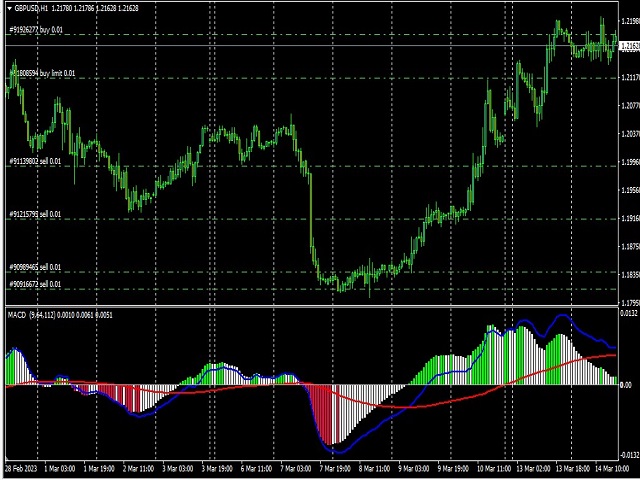
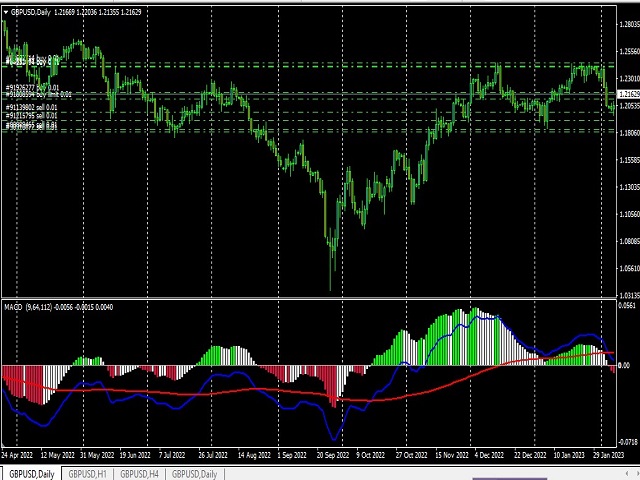
MACD Spectra, a simple but profitable trading indicator! This indicator can be used on all timeframes and all currency pairs. With an accuracy above 90%, this indicator is perfect for both novice and professional traders who are looking for the best indicator to assist their trading activities. By simply following the color of the histogram, the position of the histogram, and the position of the Signal and MACD lines, you can enter and exit the market easily. Don't wait any longer, let's get consistent profits together with MACD Spectral.
For entry and exit, reading the indicator is very easy:
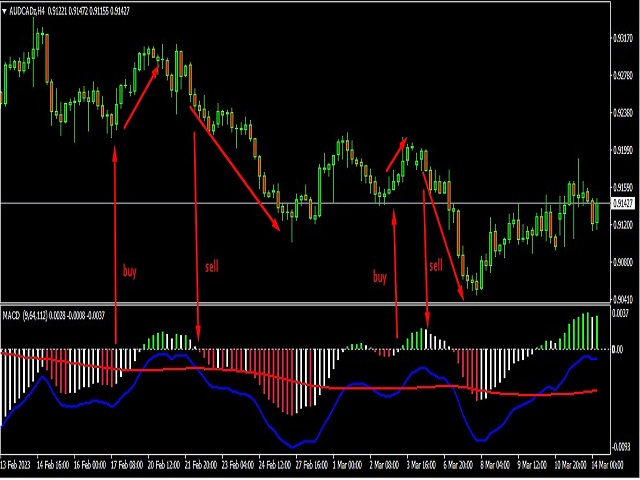
- If the blue line crosses the red line and the intersection is below the Zero line AND the histogram that appears is RED on bar 2, then it is a strong signal for SELL entry and exit when a WHITE histogram appears.
- If the blue line crosses the red line and the intersection is above the Zero line AND the histogram that appears is GREEN on bar 2, then it is a strong signal for BUY entry and exit when a WHITE histogram appears.
- Take a BUY position when a WHITE histogram appears after a RED histogram that is below 0, as confirmation on the histogram of bar 2 for BUY entry and exit when a WHITE histogram appears above 0.
- Take a SELL position when a WHITE histogram appears after a GREEN histogram that is above 0, as confirmation on the histogram of bar 2 for SELL entry and exit when a WHITE histogram appears below 0.
