Time Segmented Volume for MT5
- Indicators
- Fernando Carreiro
- Version: 1.0
This indicator is based on the original “Time Segmented Volume (TSV)” developed by Worden Brothers, Inc. However, I added an extra few features to this one.
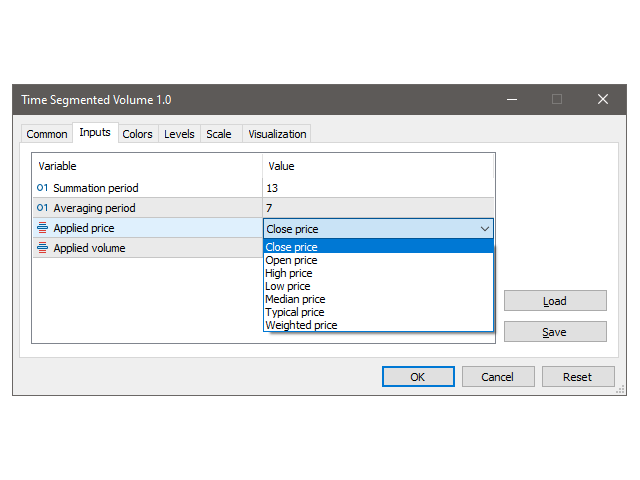
One can choose the price to be applied, instead of only having the default close price used by the original.
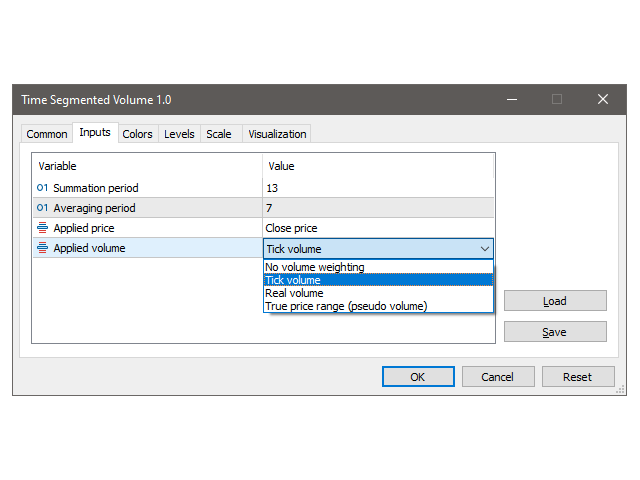
One can also choose which volume weighting to use, including a pseudo-volume based on true range, or no volume weighting at all.
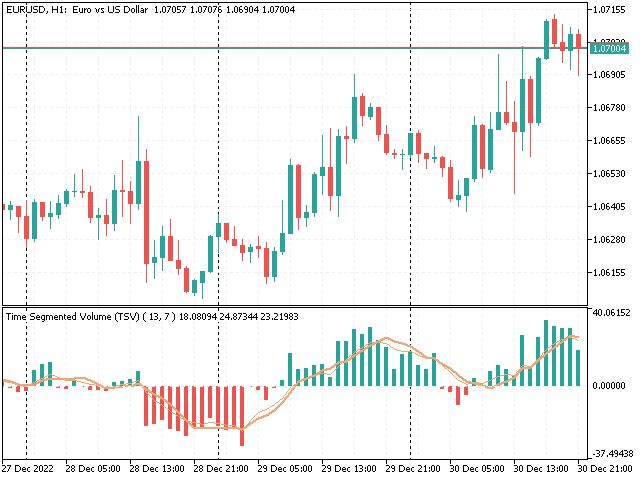


Great indicator for S/D traders. After testing, I'm using it now full time on my charts. It shows buying or selling momentum, trend increasing or decreasing momentum, trend ending momentum and potential Entry timing. Totally customizable as well. Thank you for your time and expertise in putting this together. This indicator deserves way more downloads.