Footprint Chart
- Indicators
- Thomas Bradley Butler
- Version: 1.4
- Updated: 17 February 2023
- Activations: 5
Templates in comments. Some volume indicators will be different due to different calculations/brokers etc. Some templates are for further study and aesthetics.
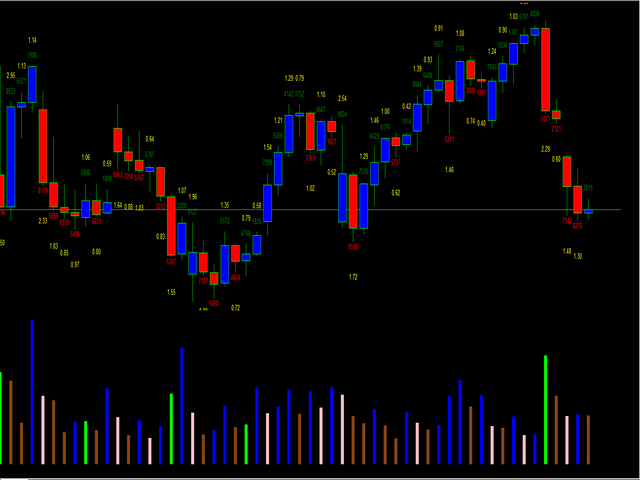
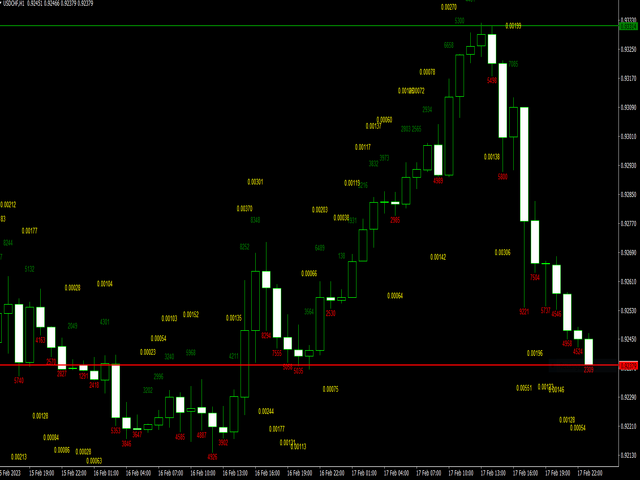
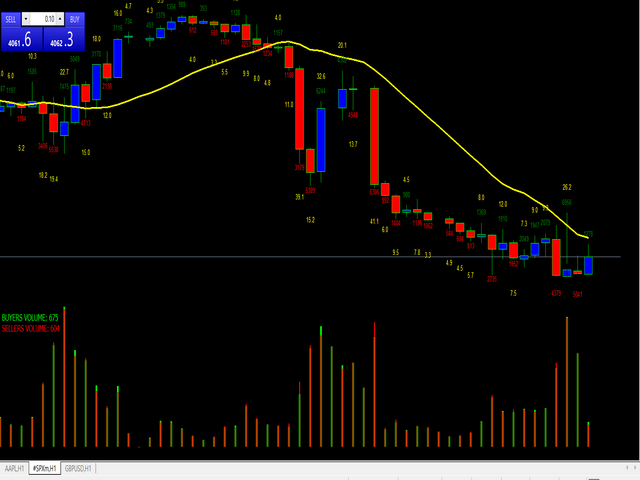
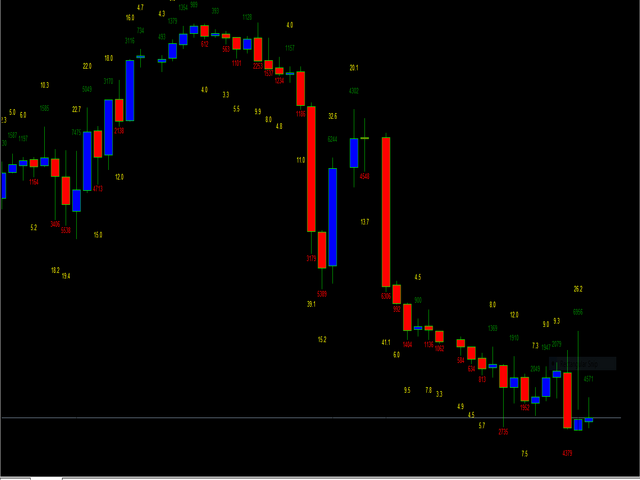
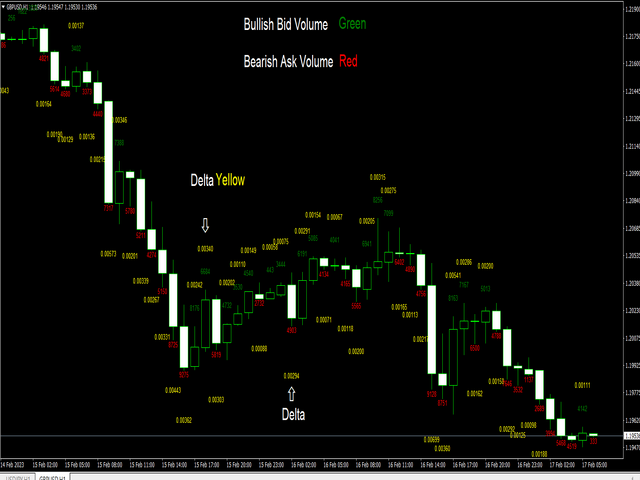
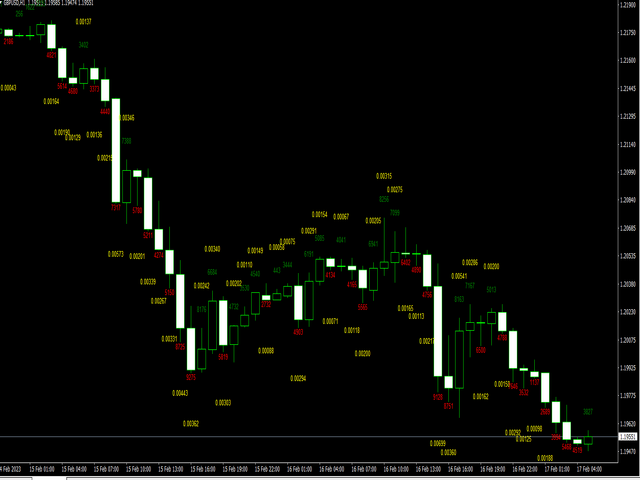
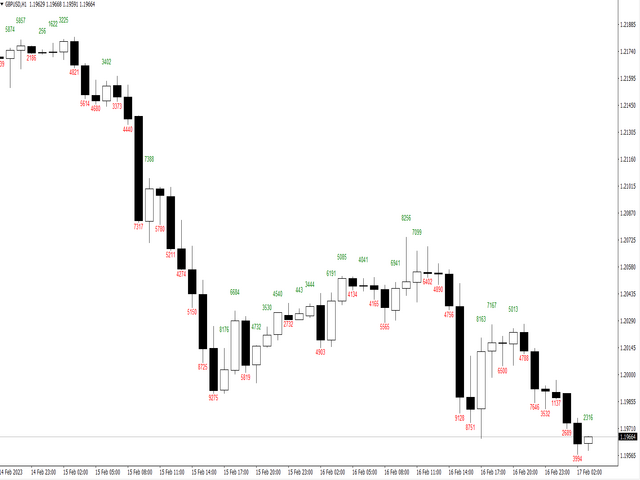
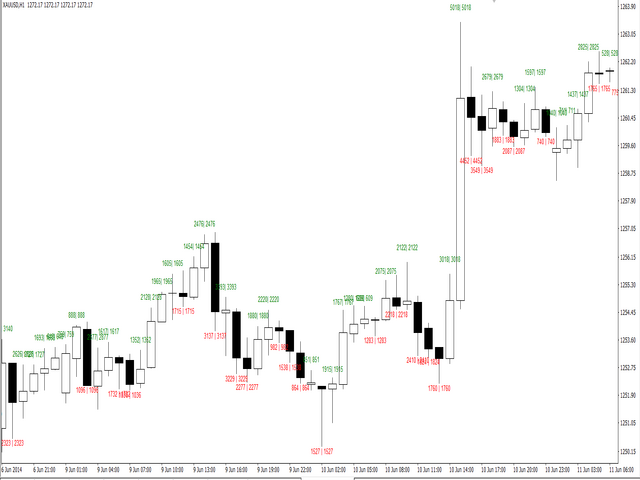
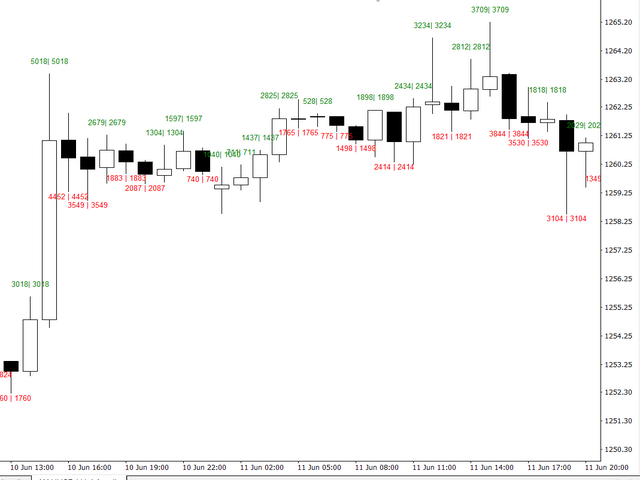
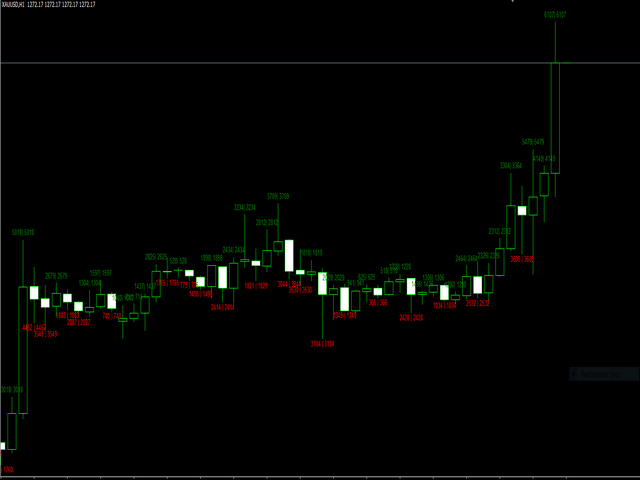
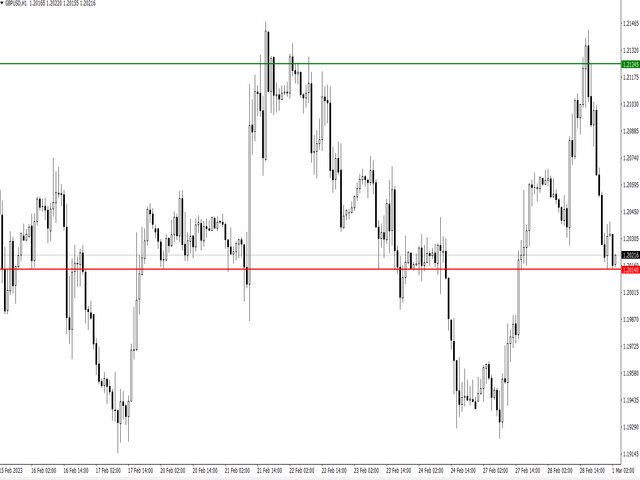
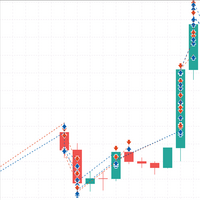
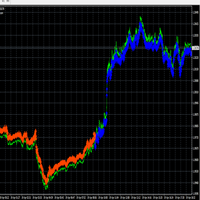
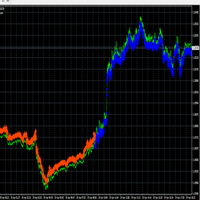
I have added a highly demanded request for a footprint chart. This is the closest you can get in mql4 without futures data or outside data, which would require subscriptions. The indicator is very basic and shows bid volumes and ask volumes. It is not a signal indicator, it will just show volumes in the candles and displays past values as well. Forex does not have centralized volume but this breaks up and shows tick volume. Selling candles will show the ending ask/red and buying candles will show the ending bid/green. Could be traded as a single system of analysis or with other factors. Can be valuable information if one observers the market in this sense.
Footprint takes the bid and ask and the bid ends high then it shows volume and green and ask end low the it shows red and is based on open and close.
Footprint may show a low bearish candle but the volume indicator in mt4 may show it it an up candle. This is due to the pervious bar so some calculations may end up different than Footprint.
Footprint calculations are for current bar:
- ask Volume = low bearish ending is ask/red
- bid Volume = high bullish ending is bid/green
- delta = the difference in the recent low verse the high or high verse low
I hope to increase the indicator with more functions and features to help with analysis and the price will reflect demand and more features. Volume indicators may appear with values a little different.
