R Delta RSI
- Indicators
- Rwy Ksyby
- Version: 1.0
- Activations: 5
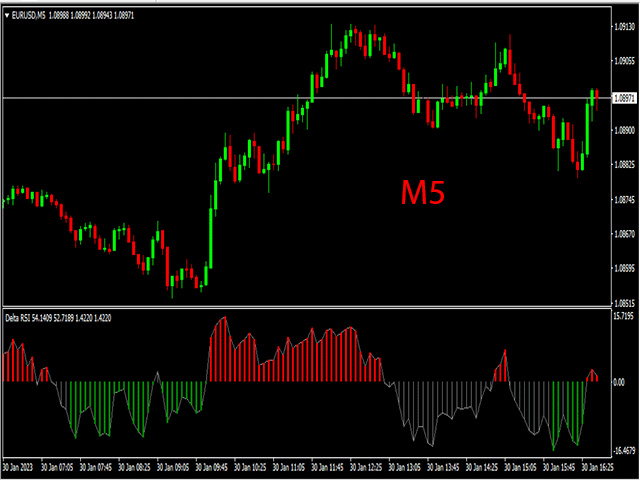
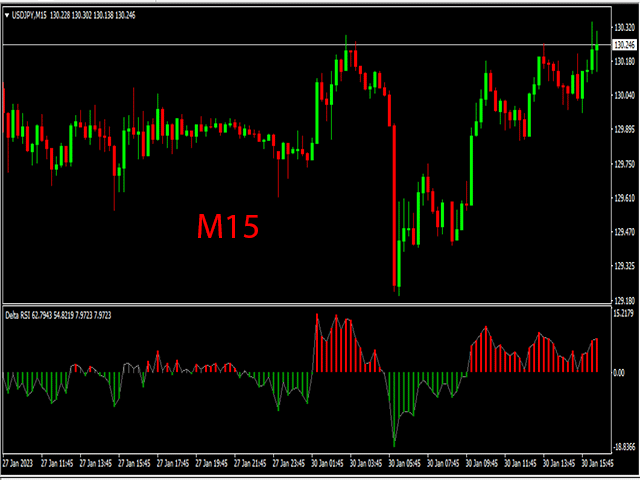
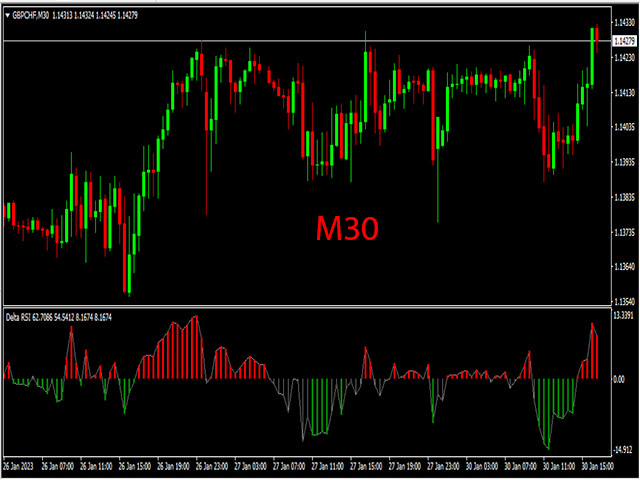
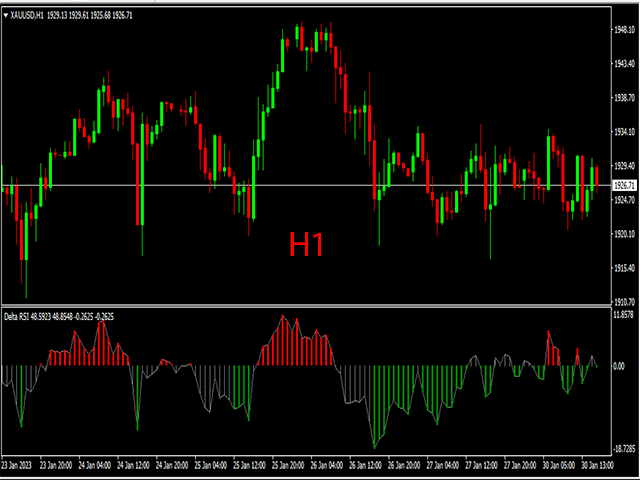
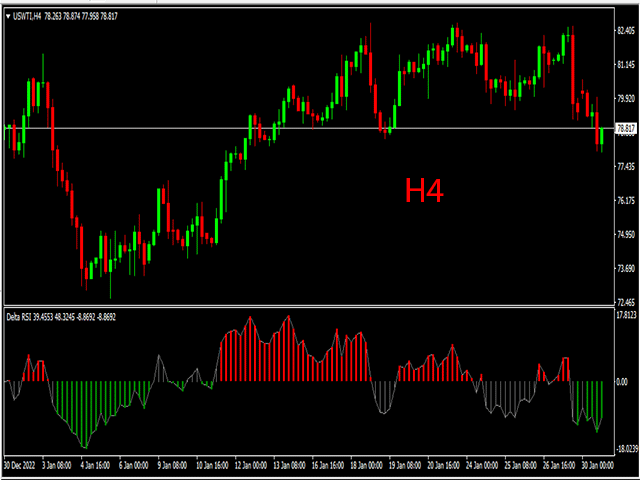
The R Delta RSI indicator draws a buy and sell colored histogram based on the crossover of a fast RSI (period 14) and slow RSI (period 50) together with a signal level.
- A red colored histogram indicates the trend is bullish (buy signal).
- A green colored histogram indicates the trend is bearish (sell signal).
- A gray colored histogram indicates the trend is flat or range-bound (no signal).
This forex indicator can be traded as a standalone or together with other trend following indicators.
Scalpers, day traders and swing traders can benefit from this excellent RSI crossover signals indicator.
The default R Delta RSI indicator settings for fast RSI, slow RSI and signal level can be changed from the indicator’s input tab.
Feel free to experiment with its settings to fit your needs.
Basic Trading Signals
Signals from the R Delta RSI forex indicator are easy to interpret and goes as follows:
- Buy Signal: Initiate buy trade position when the indicator draws a red histogram.
- Sell Signal: Initiate sell trade position when the indicator draws a green histogram.
- Flat Signal: Stay with the current buy/sell position when the bars paint gray color.
- Trade Exit: Close the open buy/sell forex position when an opposite signal occurs, or use your own method of trade exit.
Characteristics
Currency pairs: Any
Platform: Metatrader 4
Customization options: Variable (Fast RSI Period, Slow RSI Period, Signal Level) Colors, width & Style.
Time frames: 1-Minute, 5-Minutes, 15-Minutes, 30-Minutes, 1-Hour, 4-Hours, 1-Day, 1-Week, 1-Month
Type: Oscillator

