Valable ZigZag
- Indicators
- Sergey Ermolov
- Version: 2.4
- Updated: 2 May 2023
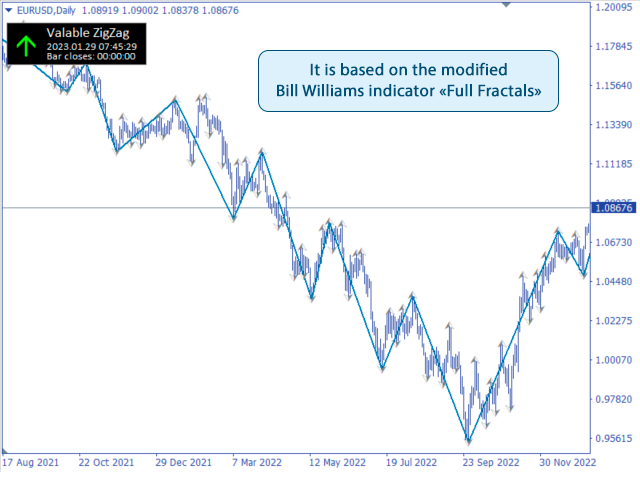
The Elliott wave theory is an interpretation of processes in financial markets that relies on a visual model of waves on price charts. The Valable ZigZag indicator displays the wave structure of the market, which can be used to make trading decisions.
The Valable ZigZag indicator is more stable and does not often change its direction like the classic ZigZag indicator, misleading traders. This is achieved through the use of fractals in the construction of indicator waves.
Telegram chat: @it_trader_chat
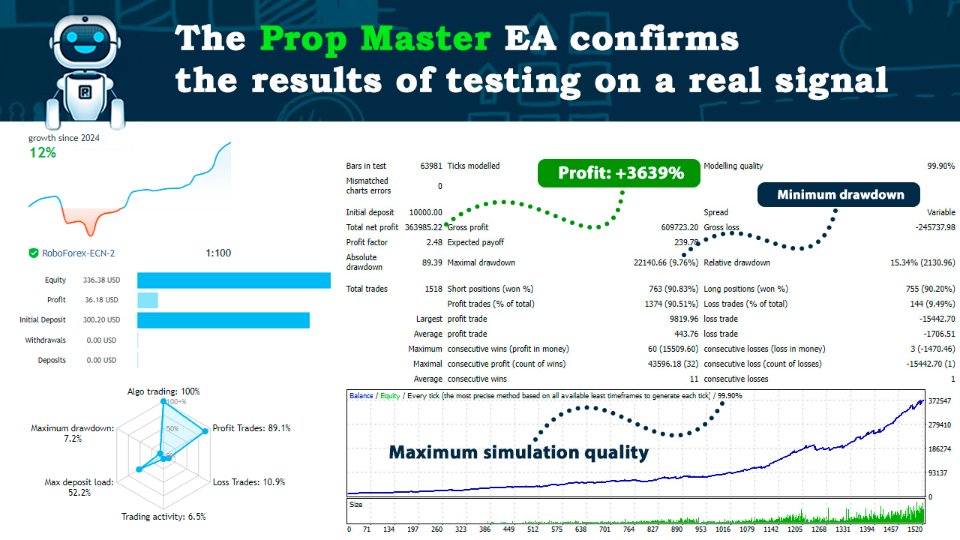
The new Expert Advisor Prop Master - test it in your trading terminal
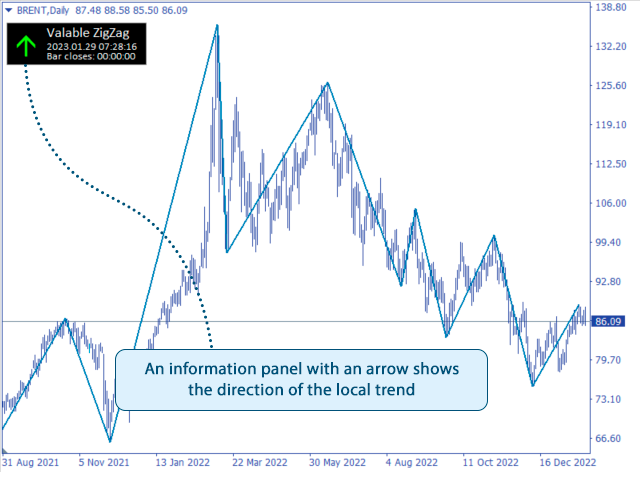
Valable ZigZag is primarily a trend indicator. It sets the main direction in which a trader should trade, but it can also serve as an indicator of entering the market.
For example.
Install the indicator on the H4 timeframe chart, and the direction of the last wave will show you the direction of the trend. Having chosen the trend trading direction, switch to the H1 timeframe and enter the market at the breakdown of the last peak directed towards the selected trend (see Figure 2).
Advantages of the Valable ZigZag indicator.
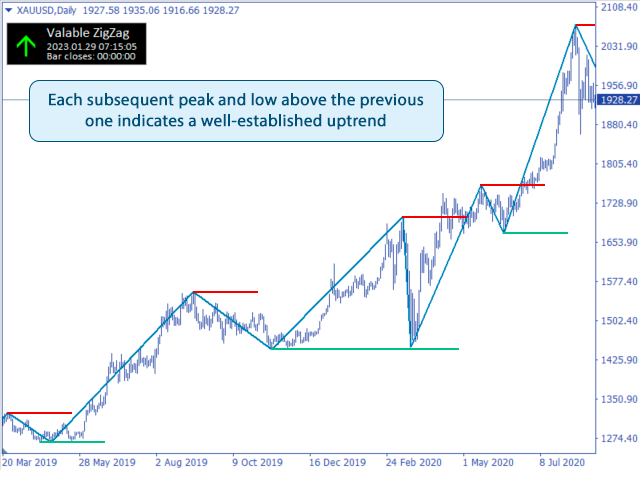
- The basis of the constructions is the price reversal levels;
- Changes direction only when the last local maximum/minimum is broken;
- Sets the right direction of trading;
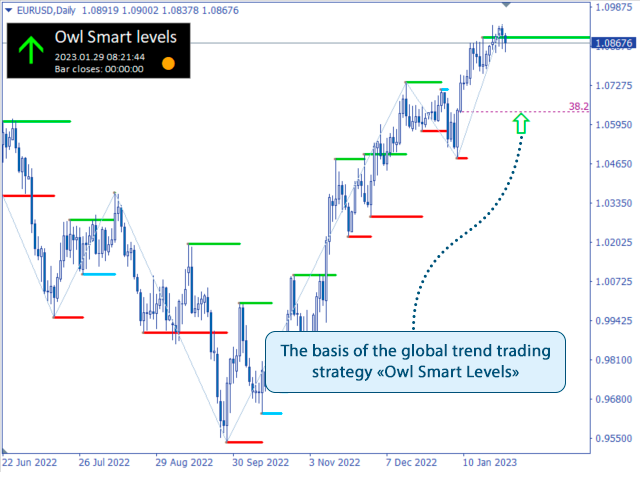
I recommend to use the indicator as part of the trading system Owl - Smart Levels. The trading system includes the basic principles of trading on a global trend and 3 simple indicators that have been tested for a century.
- Have a look at the weekly trade reviews by clicking on the link >>
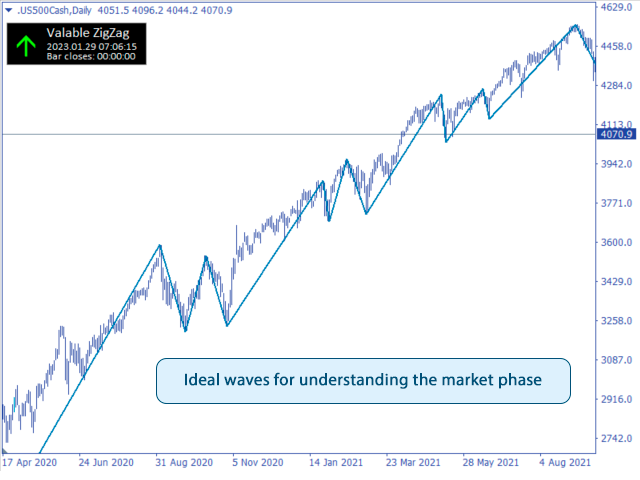
The indicator is equally well applicable both in the Forex market and in the stock market. And it works just perfectly on commodity markets and indices. Just look at the figures 5, where the indicator has perfectly plotted the full on the S&P500 index. Even in a fairly young cryptocurrency market, the indicator honors itself perfectly, and gives a clear understanding of the market phase.
Settings of the Valable ZigZag indicator.
- Candles on the left – determines the number of bars on the left to build a fractal.
- Candles on the right – determines the number of bars on the right to build a fractal
- Number of bars to calculate – the number of bars on the chart to be calculated.
- Show info panel – on/off info panel
Sergey Ermolov is with you, subscribe to my updates!


















very useful indicator as far as external fib level calculation is concerned.Good for elliotwave count as well.