R Wolfe Wave
- Indicators
- Rwy Ksyby
- Version: 1.0
- Activations: 5
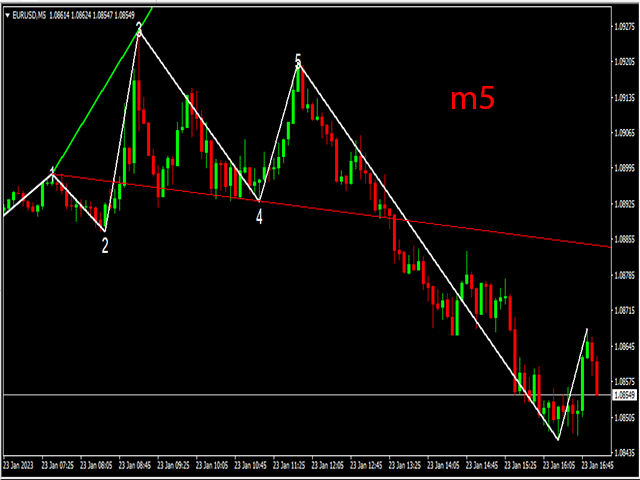
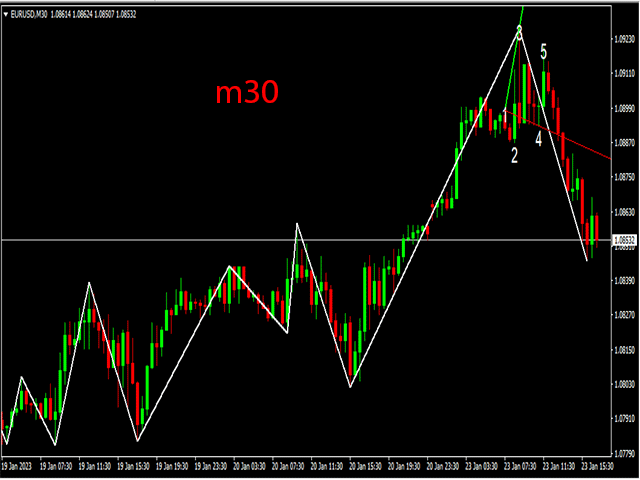
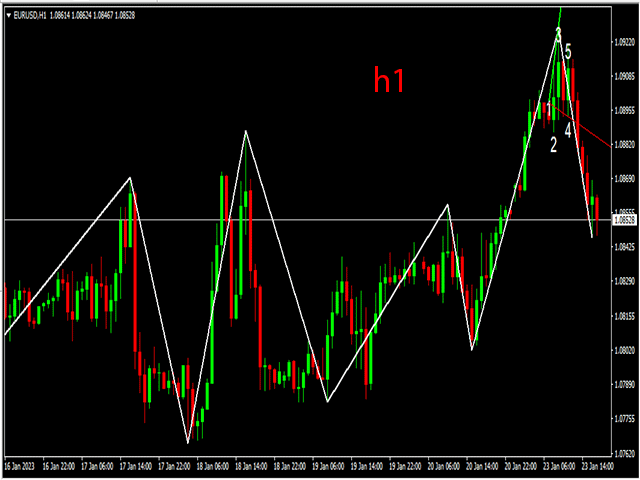
The R Wolfe Wave indicator analyses price action and transforms the accumulated data into a powerful Wolfe Wave chart pattern technical tool.
In essence, the R Wolfe Wave chart pattern can be either bullish or bearish and might help traders to open buy and sell trades without any lagging indicators.
Key Points
- Identifies powerful Wolfe Wave patterns
- For advanced traders
- Works for any currency pair
- Well worth adding to your indicator collection
This indicator can work together with any existing trading strategy or system as a trend confirmation tool.
Basic Trading Signals
BUY
- Go long when price breaks above the bullish Wolfe Wave technical pattern.
- Set stop loss below the Wolfe Wave trading pattern.
- Exit the buy trade for a predetermined profit target.
SELL
- Go short when price breaks below the bearish Wolfe Wave technical pattern.
- Set stop loss above the Wolfe Wave trading pattern.
- Exit the sell trade for a predetermined profit target.
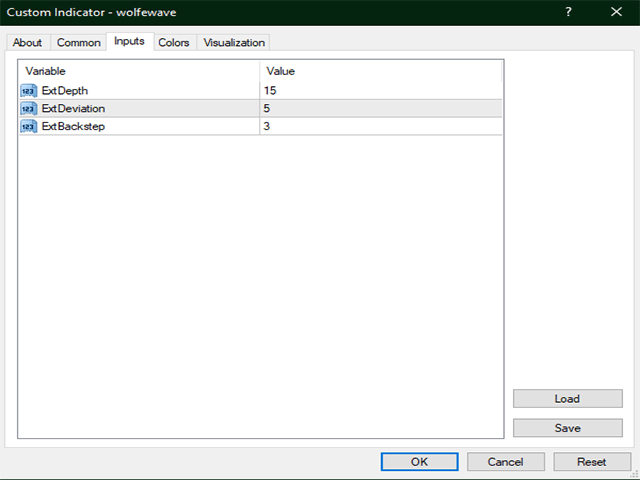
Adjustable Parameters & Settings
Depth, deviation, back step, colors, style
Feel free to explore the indicator’s different parameters and settings to create your own personalized indicator setup.
Characteristics
Currency Pairs: Any
Trading Platform: Metatrader 4
Time Frames: 1-Minute, 5-Minutes, 15-Minutes, 30-Minutes, 1-Hour, 4-Hours, 1-Day, 1-Week, 1-Month
Indicator Type: Price action
