TradeighT
- Indicators
- Lorenzo Monari
- Version: 31.48
- Updated: 9 May 2024
- Activations: 5
⭐ The tool identifies the real movement that the market uses, with real mathematical calculations based on the price changes.
⭐ TradeighT execution is based on this mathematical relationship that has always existed.
⭐ Most traders look at the same things and study the same information, for this reason the majority loses money.
⭐ It is a product based not on the ideas of the majority but on the 4 real foundations that rule the market.
⭐ The tool is a visual tool, easy to understand and simple to use, available for all backtestable symbols.
Exclusively for MT4.
The indicator uses high reaction price levels:
☆ provides current take-profit prices
☆ provides levels for use with technical analysis
☆ provides zigzag
☆ provides the current trend
☆ provides targets with high % of success
🛎️ https://t.me/tradeightrading
________________________________________________________________________________________________________________________________________________
HORIZONTAL NON-PERMANENT TRENDLINE BUYTRENDLINE (selectable)
- numbered from 1 to 5
- colour editable from INDICATOR PROPERTIES
- price to be used as takeprofit in a BUY order
HORIZONTAL NON-PERMANENT TRENDLINE SELL
- numbered from 1 to 5
- colour editable from INDICATOR PROPERTIES
- price to be used as takeprofit in a SELL order
HORIZONTAL PERMANENT TRENDLINE
- to be used as support or resistance
VERTICAL TRENDLINE
- to be used as a time reference for the start of a HORIZONTAL NON-PERMANENT TRENDLINE
________________________________________________________________________________________________________________________________________________
GENERAL METRICS
Each NUMBER is linked to a candle.
Each NUMBER has its own HORIZONTAL NON-PERMANENT TRENDLINE.
Each HORIZONTAL NON-PERMANENT TRENDLINE e has its own VERTICAL TRENDLINE.
When the HORIZONTAL NON-PERMANENT TRENDLINE is touched by the price, it disappears.
When a HORIZONTAL NON-PERMANENT TRENDLINE disappears, the NUMBER and VERTICAL TRENDLINE linked to that HORIZONTAL NON-PERMANENT TRENDLINE will disappears.
If a HORIZONTAL NON-PERMANENT TRENDLINE disappears before it has been touched by the price, a new HORIZONTAL NON-PERMANENT TRENDLINE with the next NUMBER appears in the opposite direction.
________________________________________________________________________________________________________________________________________________
VERTICAL LINES
VERTICAL LINE BUY
- color of the HORIZONTAL NON-PERMANENT TRENDLINE BUY
- indicates a TREND BUY
VERTICAL LINE SELL
- color of the HORIZONTAL NON-PERMANENT TRENDLINE SELL
- indicates a TREND SELL
________________________________________________________________________________________________________________________________________________
OPERATIVITY
The tool provides all the necessary informations to identify future price movements with extreme precision,
with the possibility of analysing the history for research and statistics.
In addition to providing all the necessary details for a complete analysis, the tool generates signals with a high % success rate.
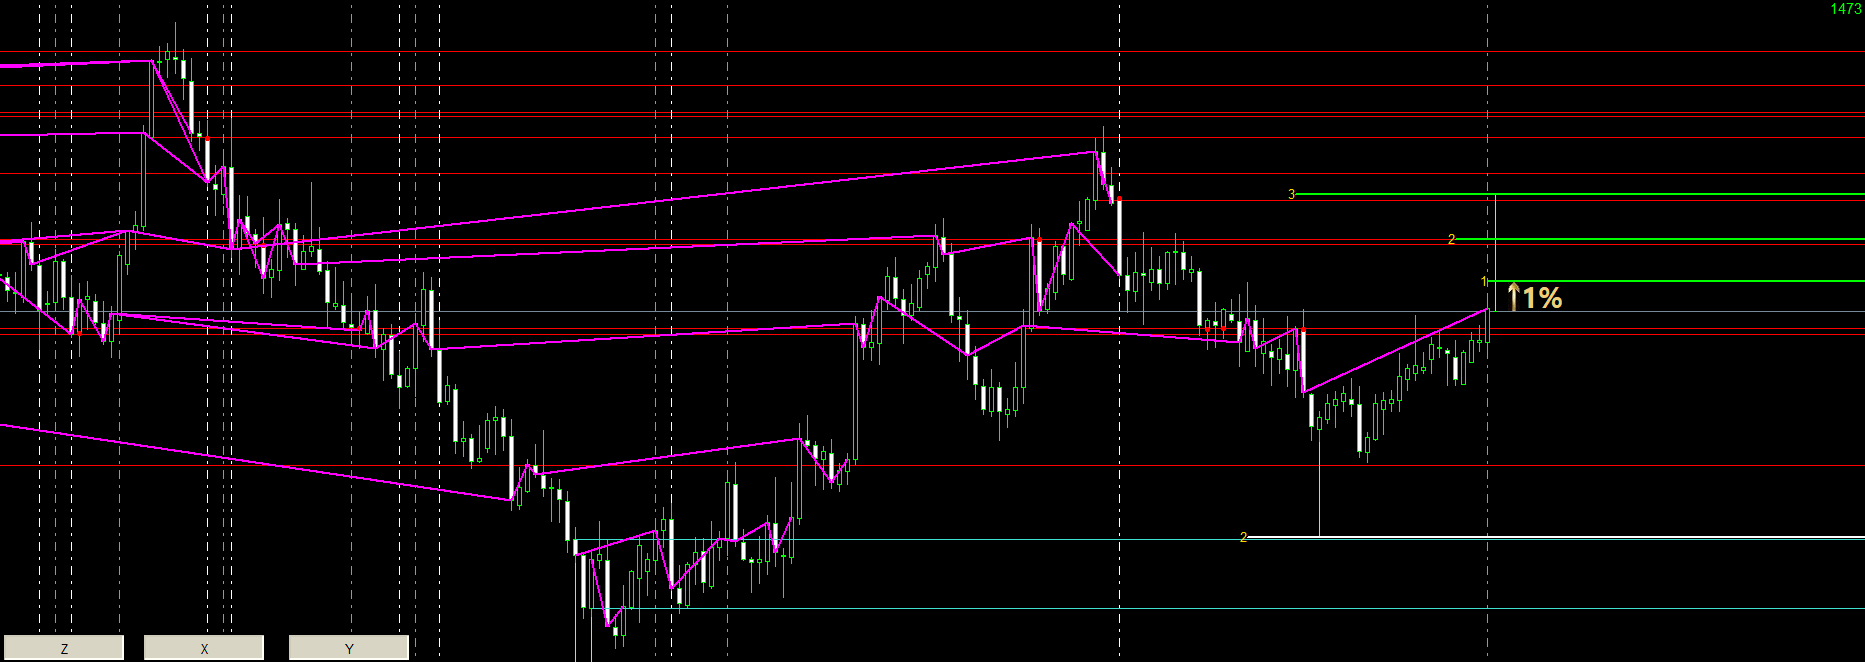
SIGNAL BUY
If the candle preceding the current one has the VERTICAL LINE BUY,
use the TP1 SIGNAL BUY as a target, i.e. the HORIZONTAL NON-PERMANENT TRENDLINE BUY 1 (TP1) with the NUMBER evidenced by the VERTICAL LINE BUY.
Calculate the volume of the investment according to the size of the movement, for a monetary value of the movement of 1% of the capital.
Example in the pictures.
If the TP1 SIGNAL BUY disappears before it has been touched by the price, choose whether to:
- change investment direction using TP2 as a new target
- interrupt the series and wait for a new TP1 SIGNAL
- close the investment
Money management plays an important role, where the investor has the choice of whether to:
- recover the loss of TP1 SIGNAL BUY with the subsequent TPs of that candle (TP2,TP3..)
- recover the loss of the TP1 SIGNAL BUY with the subsequent TP1 SIGNAL
- take the loss
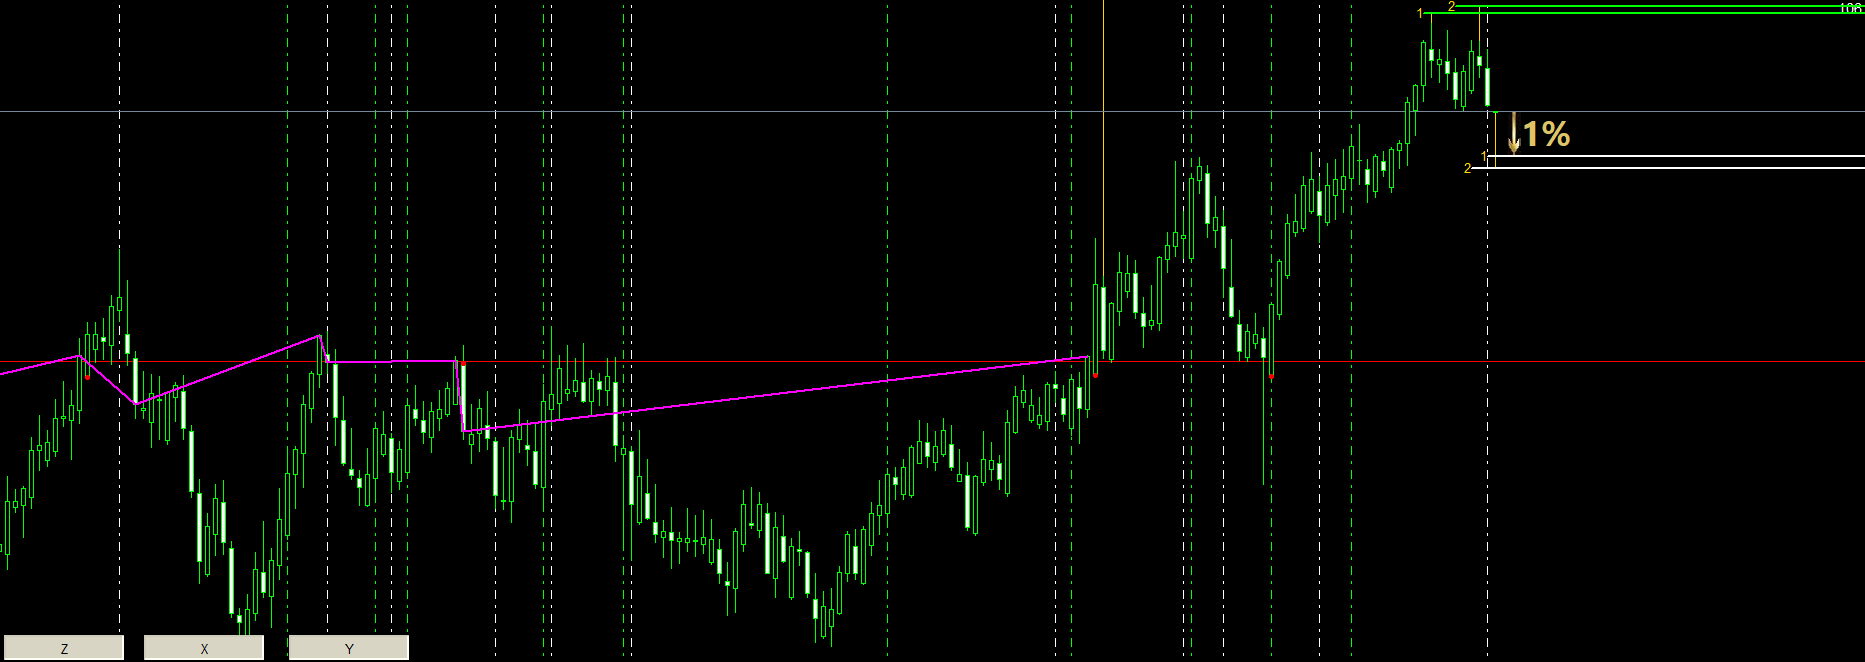
SIGNAL SELL
If the candle preceding the current one has the VERTICAL LINE SELL,
use the TP1 SIGNAL SELL as a target, i.e. the HORIZONTAL NON-PERMANENT TRENDLINE SELL 1 (TP1) with the NUMBER evidenced by the VERTICAL LINE SELL.
Calculate the volume of the investment according to the size of the movement, for a monetary value of the movement of 1% of the capital.
Example in the pictures.
If the TP1 SIGNAL SELL disappears before it has been touched by the price, choose whether to:
- change investment direction using TP2 as a new target
- interrupt the series and wait for a new TP1 SIGNAL
- close the investment
Money management plays an important role, where the investor has the choice of whether to:
- recover the loss of TP1 SIGNAL SELL with the subsequent TPs of that candle (TP2,TP3..)
- recover the loss of the TP1 SIGNAL SELL with the subsequent TP1 SIGNAL
- take the loss
________________________________________________________________________________________________________________________________________________
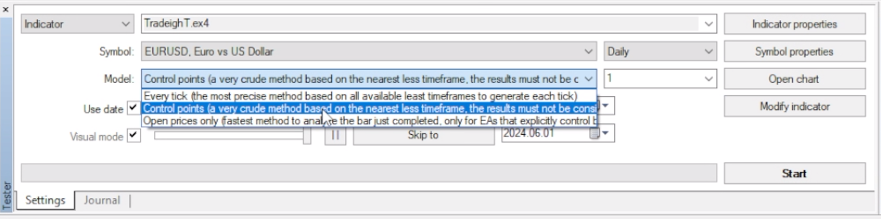
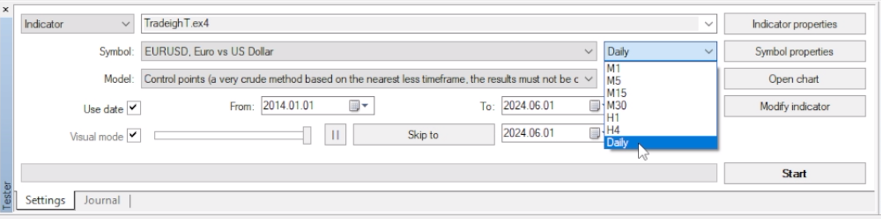
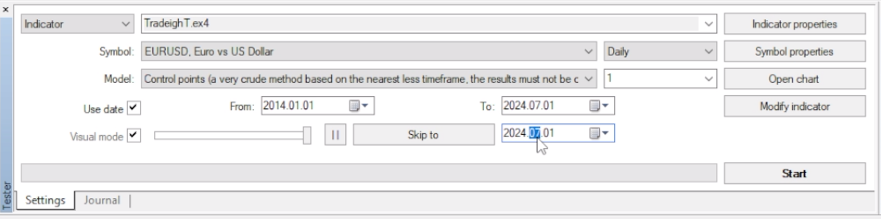
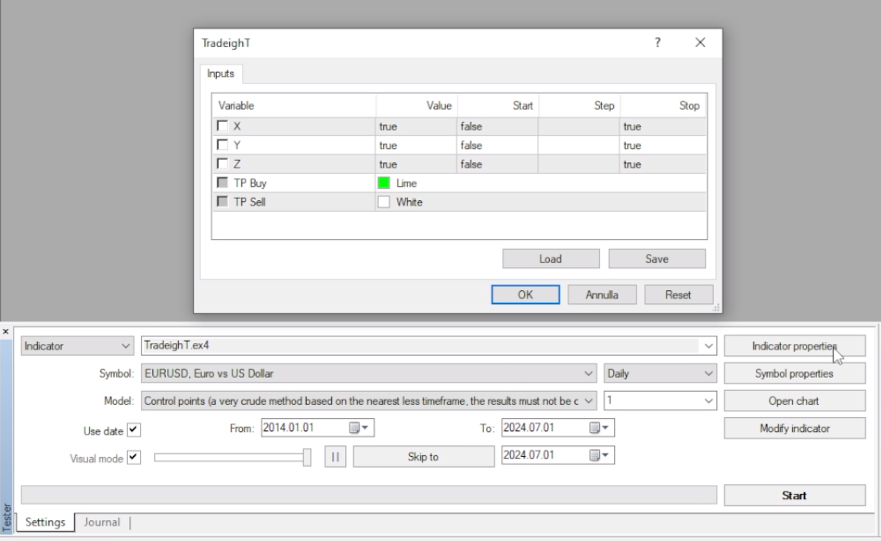
SETTINGS
- X = HORIZONTAL PERMANENT TRENDLINES
- Y = VERTICAL LINES
- Z = ZIGZAG
To have the same TEMPLATE at each backtest, open a new symbol, change colours and characteristics, and save the TEMPLATE as tester.tpl
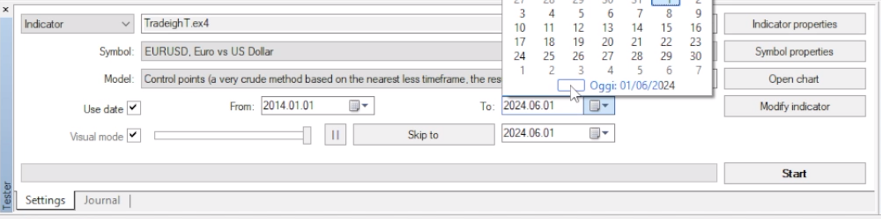
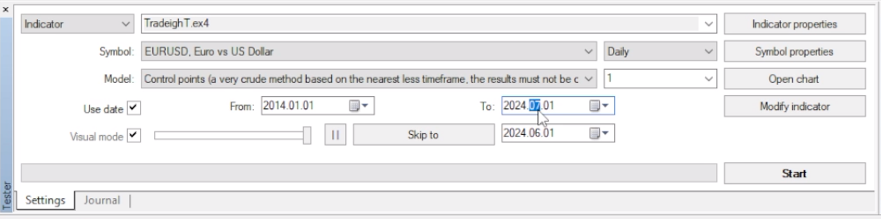
-(1)- For a complete analysis, set the backtest date at 10 years prior to the start date.
-(2)- Add 1 more month to the current date, and use it as the end date of the backtest.
-(3)- To speed up the backtest, press the SKIP TO button and enter the date equal to the end date of the backtest.
See images for further details.
________________________________________________________________________________________________________________________________________________
Sign up to the private Telegram group to exchange opinions and analyses with other users.
User didn't leave any comment to the rating