DYJ ControllerRSI
- Indicators
- Daying Cao
- Version: 1.0
- Activations: 5
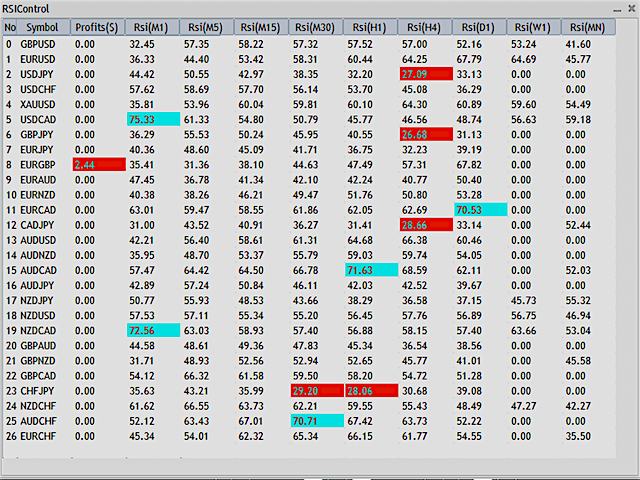
You can make the right transaction based on this information
Please make an RSI indicator template named DYJ RSI and save it. When you click the overbought area or overbought area with the mouse, the chart of the corresponding currency versus period will be automatically opened, and the RSI indicator will be loaded.
INPUT
InpPairs = "GBPUSD,EURUSD,USDJPY,USDCHF,XAUUSD,USDCAD,GBPJPY,EURJPY,EURGBP,EURAUD,EURNZD,EURCAD,CADJPY,AUDUSD,AUDNZD,AUDCAD,AUDJPY,NZDJPY,NZDUSD,NZDCAD,GBPAUD,GBPNZD,GBPCAD,CHFJPY,NZDCHF,AUDCHF,EURCHF";
InpStrategyMinTimeFrame = PERIOD_M1 -- Strategy MinPeriod
InpStrategyMaxTimeFrame = PERIOD_MN1 -- Strategy MaxPeriod
InpRSIOversold = 30 -- RSI oversold zone
InpRSIOverbought = 70 -- RSI overbought zone


