Trend Signals Alerts
- Indicators
- Obaida Kusibi
- Version: 1.0
- Activations: 5
Trend-following and non-repainting forex trading gauge.
Its signals are calculated and provided in a totally automatic way and are based on moving averages intersections. It’s a newbie-friendly tool as these signals are presented in the form of simple buy/sell arrows. Nonetheless, signal reliability is really solid. You can use it in conjunction with any forex trading strategy.
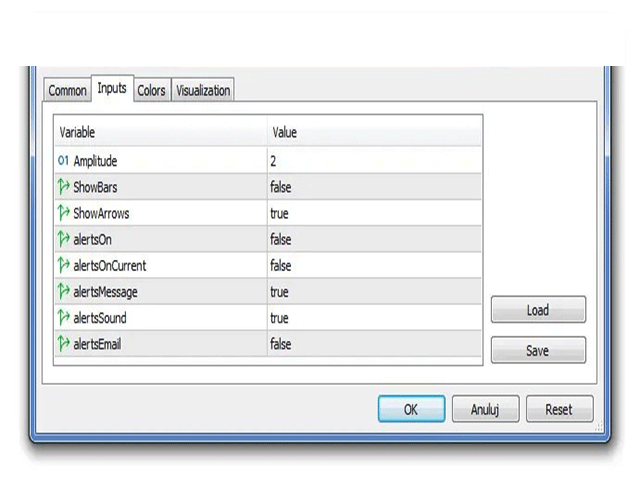
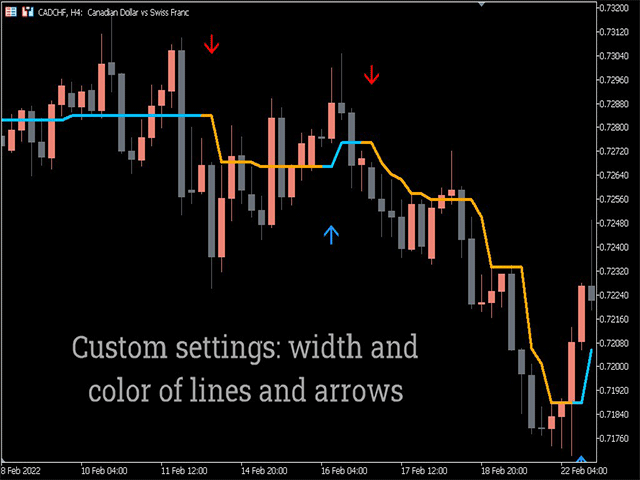
The Trend Signals Alerts Indicator fits all kinds of timeframes and currency pairs. It is displayed directly on the main trading chart. The default settings can be modified directly from the input tab.
Closer look on the Trend Signals Alerts Indicator
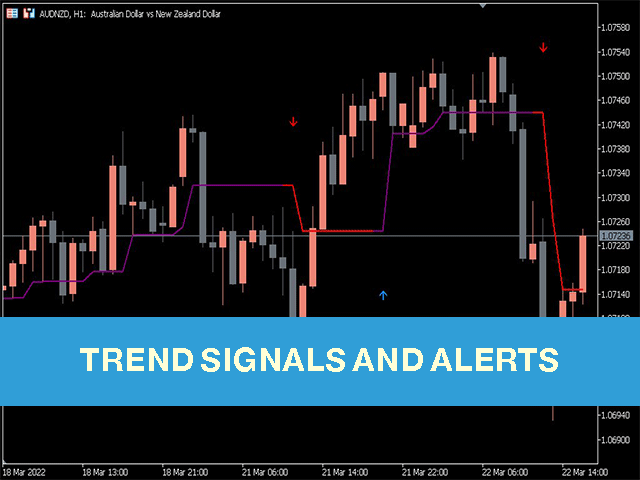
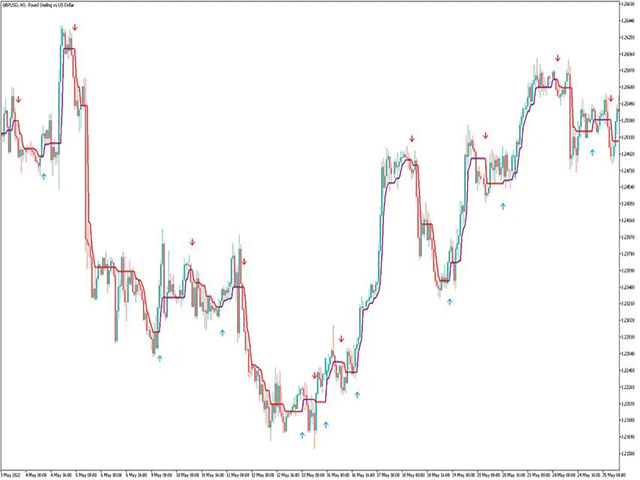
The main idea behind that indicator is to provide a simple way of demonstrating market trends and trade signals. In the result, both beginners and advanced traders can take advantage of the tool. Just take a look, how it looks when activated in MT5 in the screenshots.
Trend Signals Alerts Indicator Anatomy
As you can see, it’s just a line with buy/sell arrows to trade accordingly. The arrows are placed in the same place where intersection of moving averages happens. However, one cannot change periods of these moving averages.
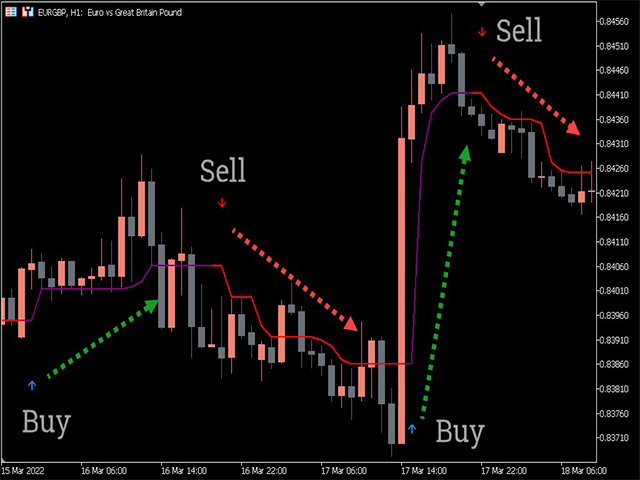
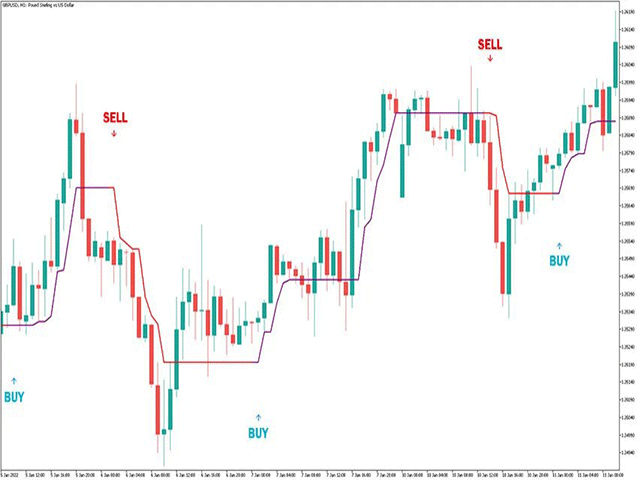
Trend Signals Alerts Indicator: Buy Signal
Follow these tips for a long trade signal:
1.Upward arrow occurs
2.Open buy trade after triggering candle close
3.Set stop loss a few pips below the most recent market low
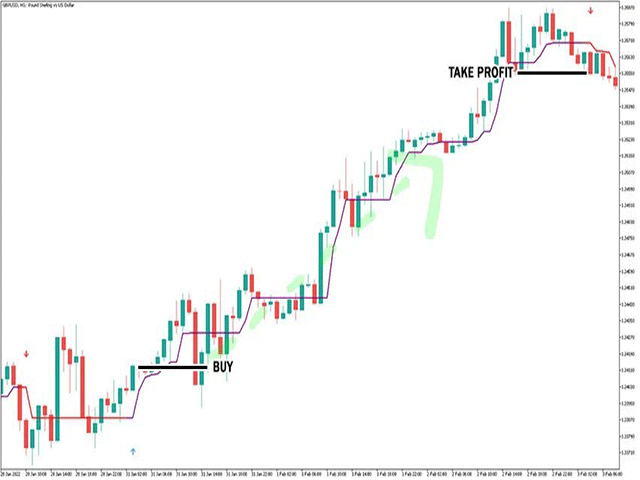
4.Keep your position open till opposite signal happens or use your own trade exit strategy
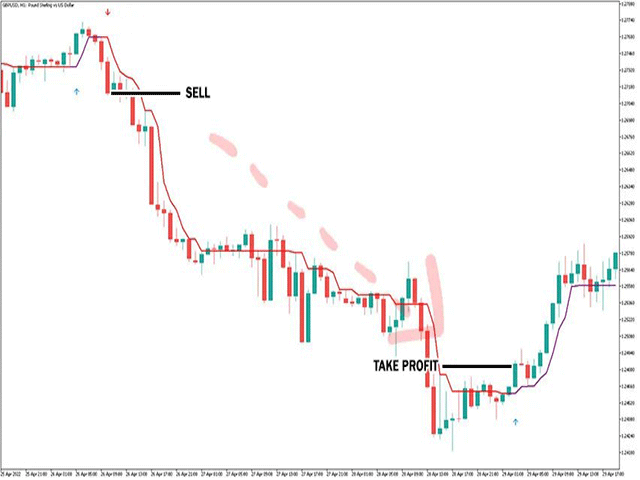
Trend Signals Alerts Indicator: Sell Signal
Follow these tips for a short trade signal:
1.Downward arrow occurs
2.Open sell trade after triggering candle close
3.Set stop loss a few pips above the most recent market high
4.Keep your position open till opposite signal happens or use your own trade exit strategy