DSZ Smart Volume
- Indicators
- Dariusz Szewczyk
- Version: 2.0
- Updated: 28 January 2022
- Activations: 5
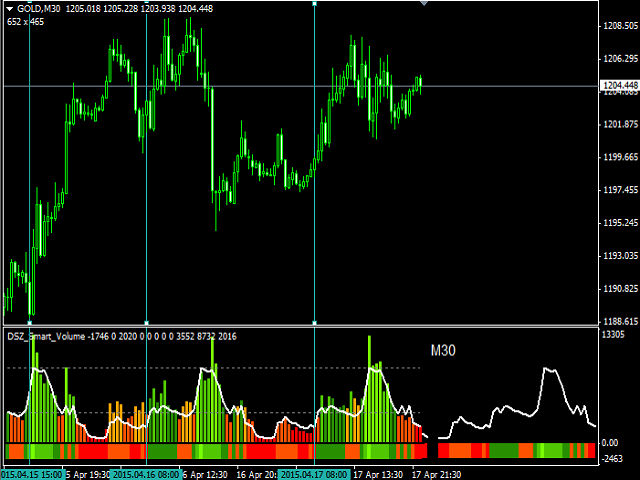
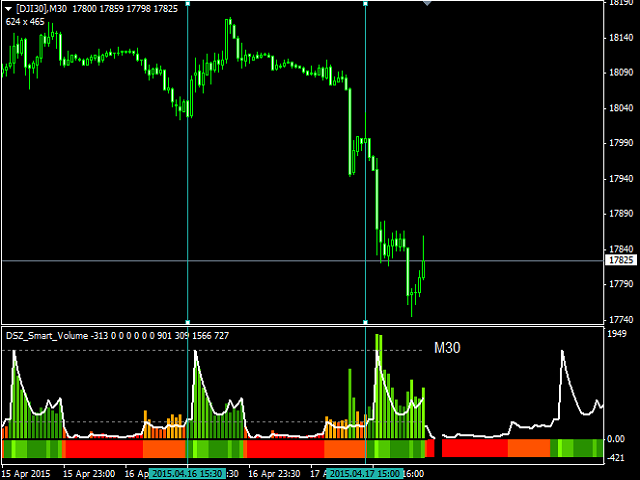
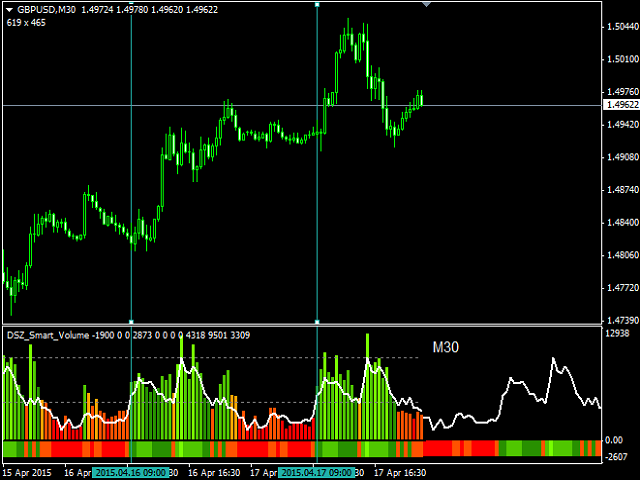
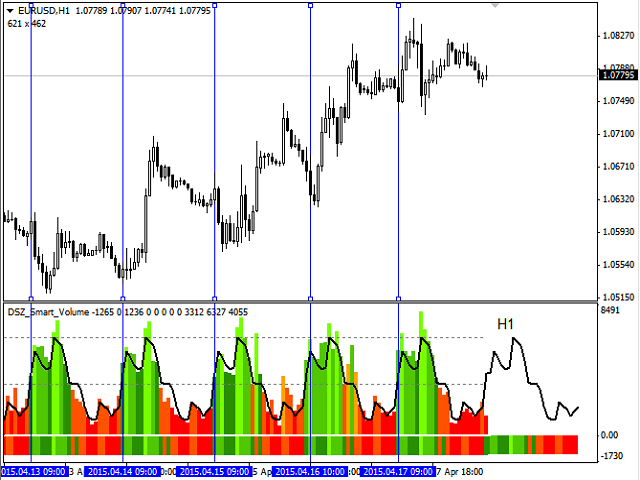
DSZ Smart Volume indicator displays the current and future values of the volume. Every instrument has its own personality which comes from events like market openings, lunch times, news releases and night. DSZ Smart Volume simply analyzes volume statistically to create volume distribution over day. Volume bars are red if values are below average and green when above.
The line represents volume distribution over a day. Colored band in the bottom represents volume distribution.
Interpretation
Red
- Volume below average.
- Wider spread.
- Low price range.
- Low probability for profitable trade.
Green
- Volume over average.
- Thinner spreads.
- Wider price ranges.
- Bigger probability for profitable trade.
Transition Red -> Green And Rising Volume Distribution
- New money on the market.
- Beginning of new big price moves.
Transition Green -> Red And Failing Volume Distribution
- Money sinks from market.
- Ending of big price moves.
- Price corrections or reverses.
Parameters
- Period – current or custom one.
- Height in % – size of the indicator window in percentage of chart height.
- Height in pixels – minimal size of indicator window in pixels.
- Joined Bars – display bars without spaces for less eye stress.







Very good indicator to read intraday price action.