Currency Power Meter Linear MT5
- Indicators
- Sergey Efimenko
- Version: 2.4
- Updated: 17 January 2022
- Activations: 15
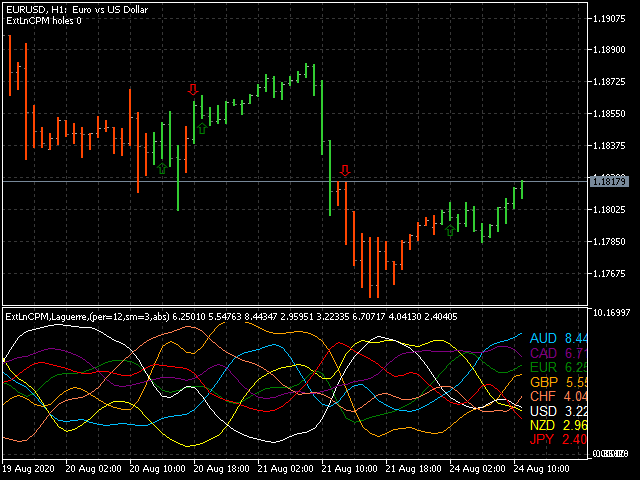
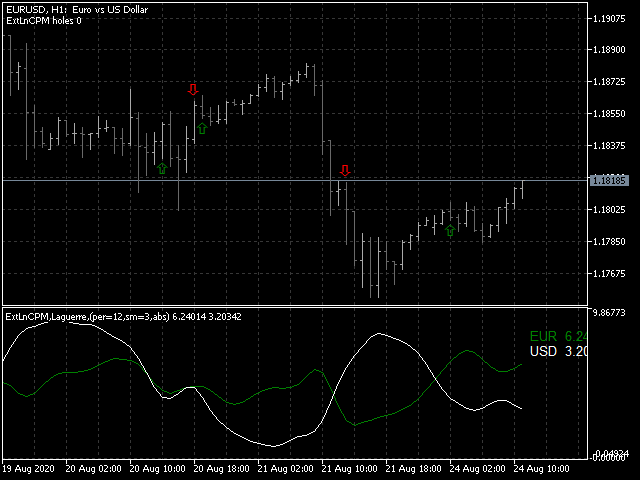
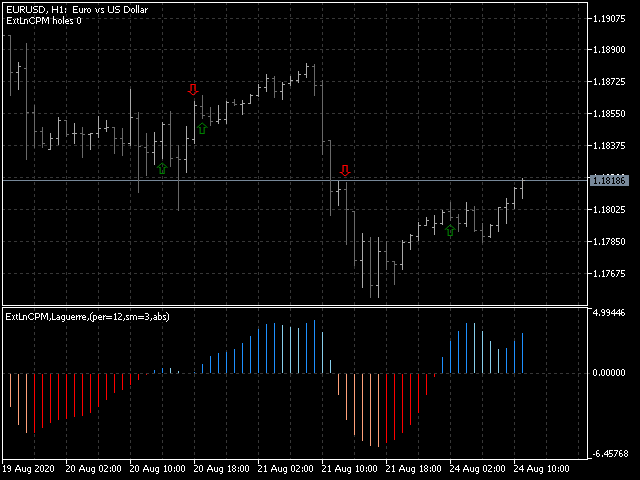
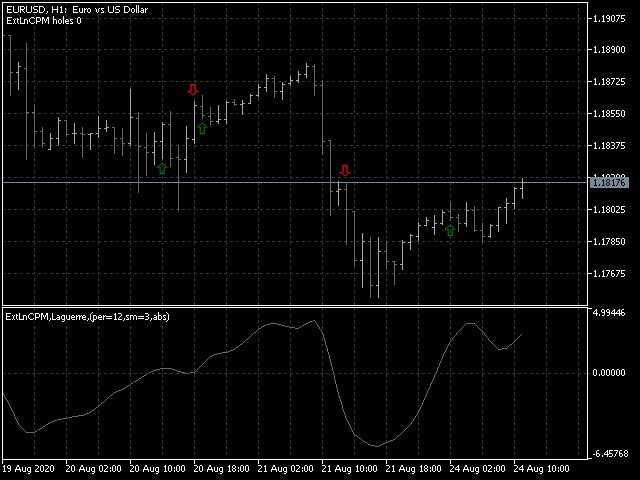
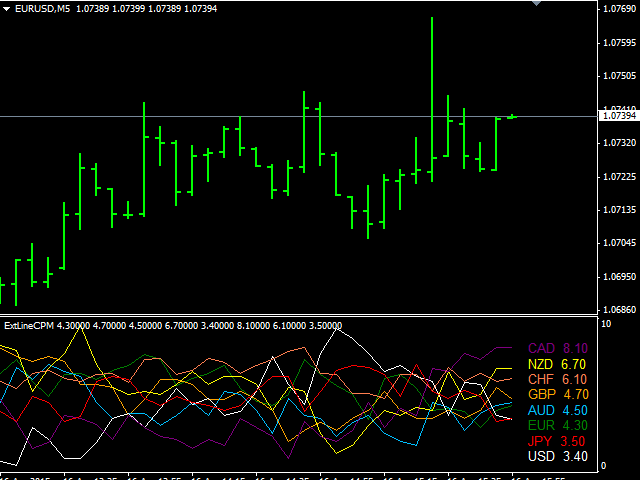
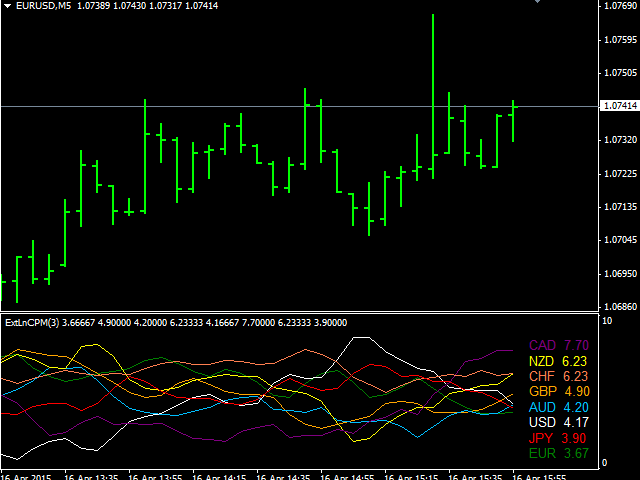
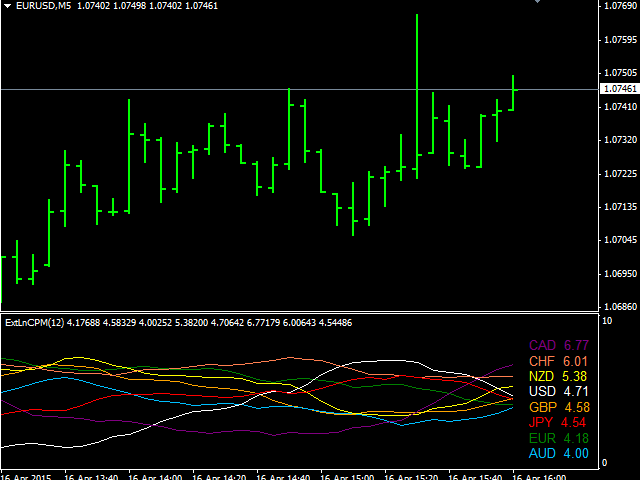
This is a linear indicator of a currency power having the ability to filter by smoothing values. It shows the current power of selected currencies (the maximum number is 8), as well as historical values. Calculation depends on the selected chart timeframe the indicator is launched at.
The indicator displays data as lines for all currencies or as a histogram for the current currency pair. The intersection of the currency strength indices for the current currency pair is additionally displayed as arrows on the chart. The current trend direction is highlighted by the coloring of the bars.
Main settings:
- iPeriod - number of bars used to analyze currency power.
- HistoryBars - number of calculated bars on history. The parameter affects execution time during the first launch. It is also necessary for reducing the necessary history data in case a broker has limitation on history length.
- SmoothingPeriod - data smoothing period (to enable smoothing, set to 1).
- SmoothingMethod - data smoothing method.
- ShowPairLabels - enable/disable display labels with names of currencies in the left part of the indicator window.
- LabelsFontSize - currency label font size.
- ShowRatio1-8 - currency name to be displayed.
- UsePairs - list of symbols for currency power calculation.
- PairPreffix - additional prefix of currency pairs. For example, in EURUSD.e symbol, ".e" is a prefix.
- ShowWarningComments - enable/disable comments on the operation errors, for example, the absence of symbol quotes or insufficient symbol history length at a broker's side.

Отличная работа! Индикатор не только самостоятельная торговая система, но и прекрасный фильтр для других инструментов! Спасибо за обновление!