Realtime Stop Hunting
- Indicators
- Ning Liu
- Version: 1.0
- Activations: 5
Realtime Stop Hunting
Background
What Is Stop Hunting? I refer to the definition of Stop Hunting from Investopedia, Stop hunting is a strategy that attempts to force some market participants out of their positions by driving the price of an asset to a level where many individuals have chosen to set stop-loss orders. The triggering of many stop losses at once typically creates high volatility and can present a unique opportunity for investors who seek to trade in this environment.
Setting up the stop-loss order is to protect account capital. However, it is very frustrating when the market goes against the opened order for some distance that it is just enough to trigger the stop-loss order and quickly pull back.
We present a simple and effective indicator of Realtime Stop Hunting, which give you the overview of the market situation. It gives the average range of stop-loss order for some market participants, which is vulnerable to stop hunting.
Main features
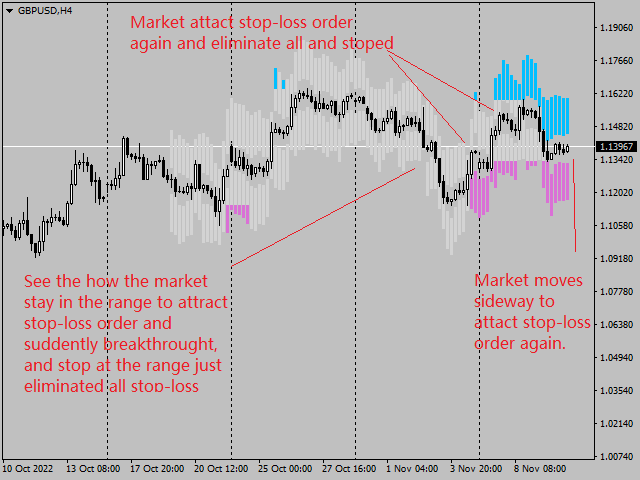
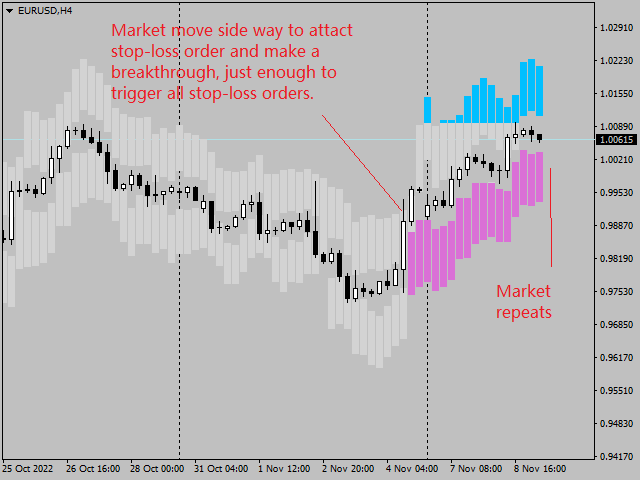
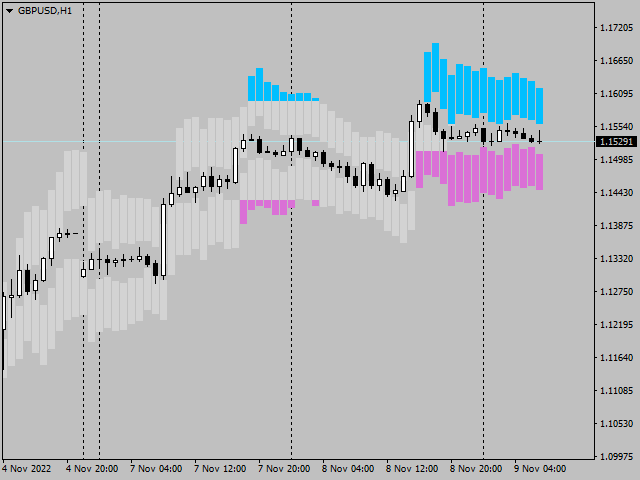
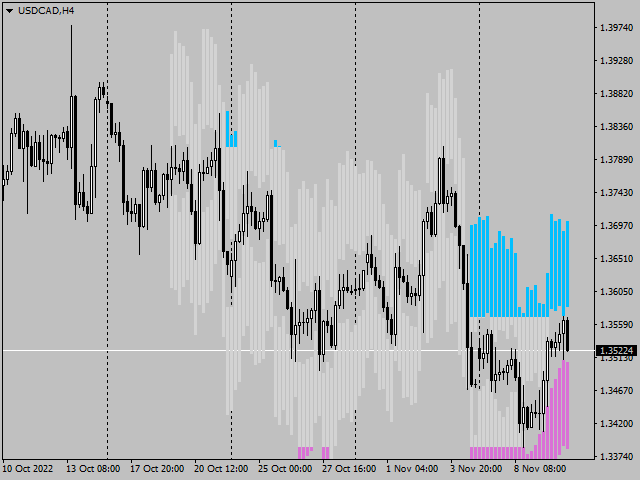
This is a Realtime Stop Hunting chart based on statistical model for participant setup of stop-loss order. Blue bars are those seller’s stop-loss order, which is a buy order. While pink bars are those buyer’s stop-loss order, which is a sell order.
In any situation, there are always both sell orders buy order executed in the market, therefore these stop-loss orders are symmetrically distributed long the market. The Gray bars shows historical range of stop-loss order which is either been triggered or been removed after reaching target profit.
The market can move to either direction, however based on the distribution of existing stop-loss order, you can determine where the market going to stop, because there runs out of stop-loss orders, if the market want to move further, it needs to stay around that range for a while to attract many participants, or in other words, more stop-loss orders, then the market move again.
Parameter
ShowUnit: to number of historical units.
Near Stop Loss Scalar: This is used to adjust the range of nearest stop-loss order.
Far Stop Loss Scalar: This is used to adjust the range of furthest stop-loss order.
These two scalars can be used to fine tune for the market. The stop-loss order range for different time frame are usually different due the different strategy used by participants.
Implementation
Simply attached the indicator to the chart it will works well.
Please give your valuable feed back for me to improve the indicator.
(I am developing similar indicator implemented as expert advice, therefore you can check different time, how the market eliminate stop-loss orders)
