Diamond by MMD MT5
- Indicators
- Mariusz Maciej Drozdowski
- Version: 7.33
- Updated: 26 April 2023
- Activations: 5
Diamond by MMD
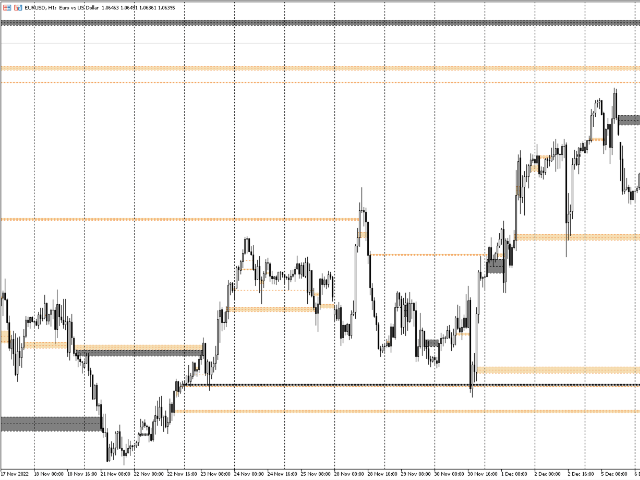
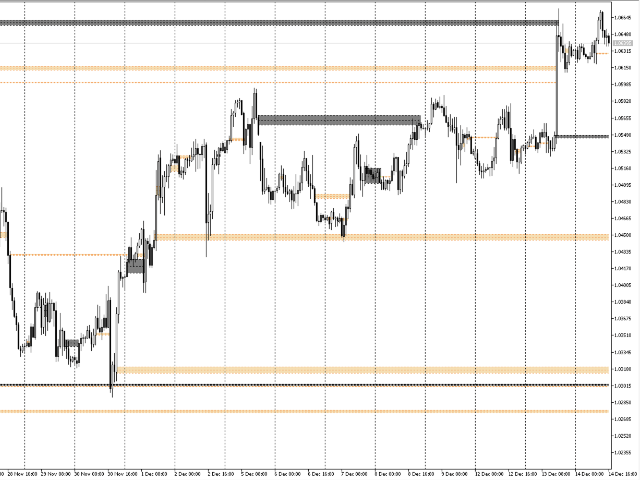
Diamond by MMD is an advanced indicator that identifies places that are important for price behavior.
This indicator - on any timeframe - detects and marks price reaction zones on the chart.
Diamonds - one of the elements of the knowledge pyramid in the MMD methodology - are candles that meet very strict conditions.
There are two main types of diamonds:
- - standard diamond,
- - reversed dementia.
Both of these models are automatically identified and marked on the chart.
The indicator can mark diamonds, e.g. from the M5 interval on the H1 interval. The indicator's default setting shows diamonds on the timeframe you currently have your chart open on.
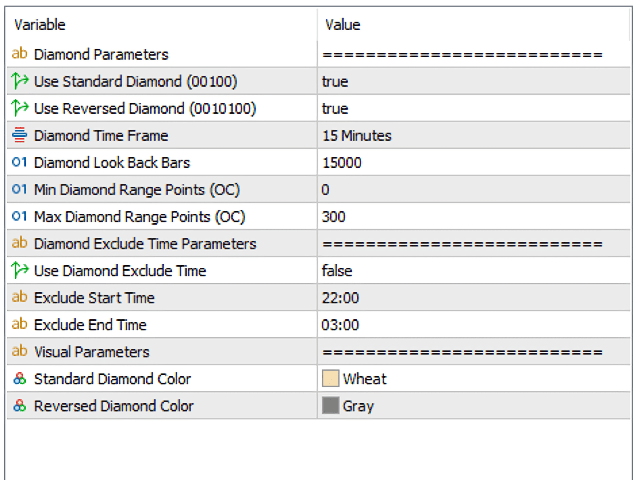
Description of the indicator parameters.
Use Standard Diamond - shows/hides diamonds in model 00100
Use Reversed Diamond - shows/hides diamonds in model 0010100
Diamond Time Frame - an option that allows you to indicate the interval from which diamonds are to be shown. It is possible to show, for example, diamonds from the M5 interval on the chart with M1 or H1 candles.
Diamond Look Back Bars - specifying the number of candles - on a given interval - which will be scanned - in search of candles that meet the parameters selected for diamonds.
Min Diamond Range Points - minimum diamond size (in points).
Max Diamond Range Points - maximum diamond size (in points).
Use Diamond Exclude Time - activation/deactivation of the parameter. This parameter is responsible for determining the time when candles that meet the conditions set for diamonds will not be marked on the chart. This applies in particular to night hours.
Exclude Start Time - indication of the beginning of the period in which diamonds will not be marked.
Exclude End Time - indication of the end of the period in which diamonds will not be marked.
Standard Diamond Color - the color of the standard diamond.
Reversed Diamond Color - the color of the reversed diamond.