Easy Technical
- Indicators
- Sayed Mohammad Mosavi
- Version: 2.0
- Updated: 16 October 2022
- Activations: 5
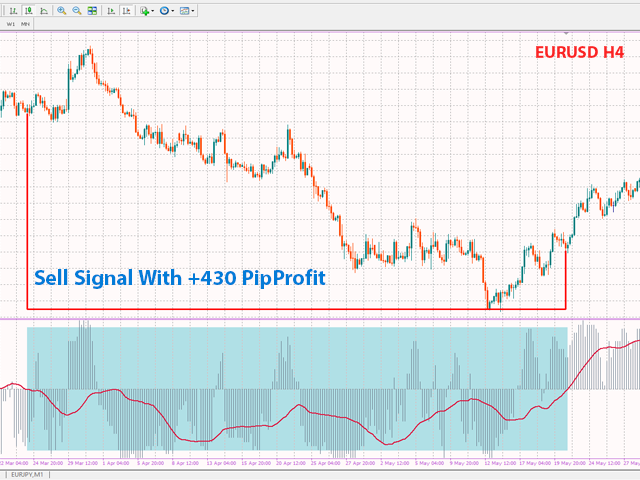
Easy Technical Indicator is a powerful tool to detect the market trend and its strength.
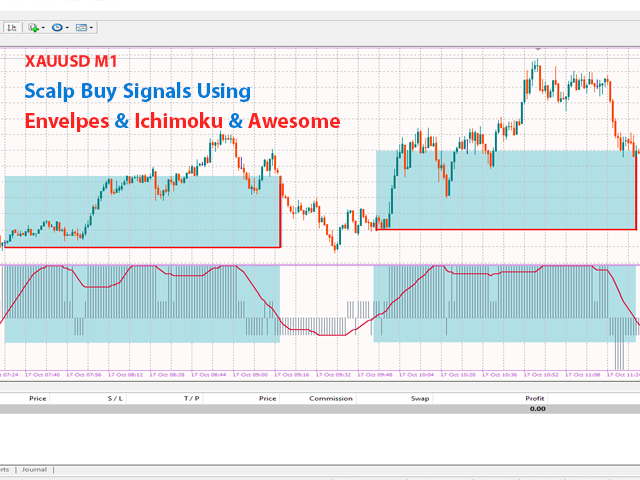
in addition, The signal Line reduce volatility and convert main trends to reliable Buy or Sell Signals
--- Contact me in messages for free gift after purchase! ---
HISTOGRAM:
- It shows the main trend of the market.
- A histogram above zero means that the market is bullish
- A histogram below zero means that the market is bearish
- The height of the histogram bars indicates the strength of the trend
- weak, normal and strong bullish or bearish is shown by histogram bars height
- When the bars reach 100 & -100, it means the market is overbought & oversold
- When the histogram does not form (equal to zero), it indicates a neutral market
SIGNAL LINE:
- The main task of the signal line is to reduce volatility of the histogram
- Signal line ignore the opposite trends, minor correction and neutral trends
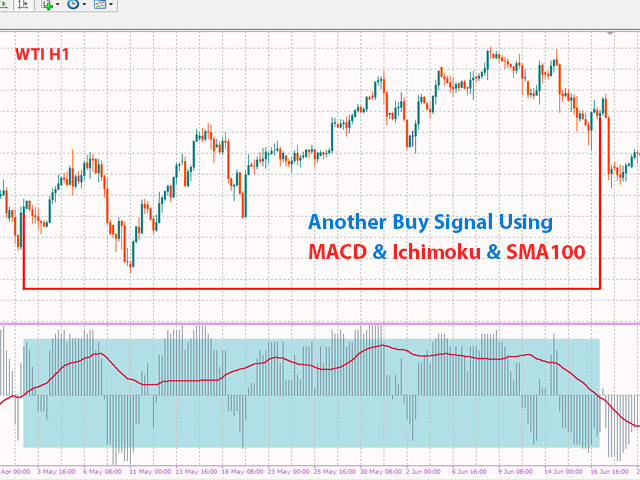
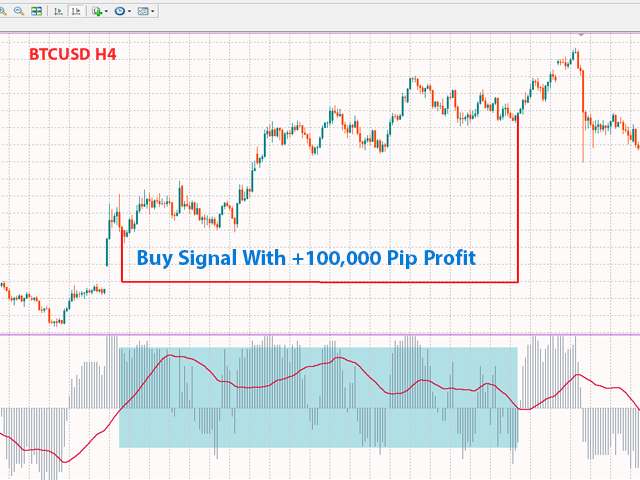
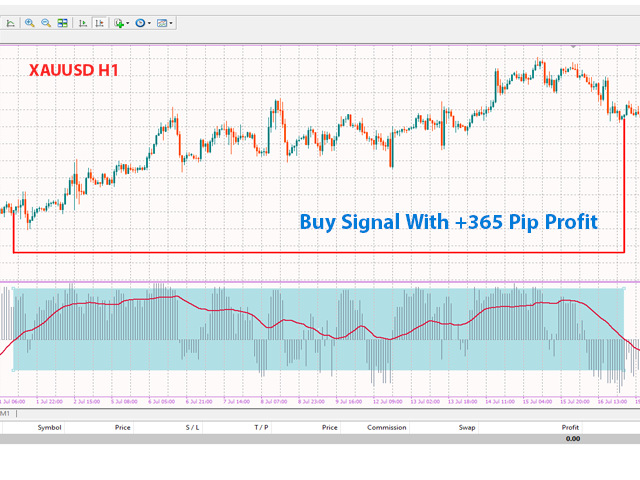
- Crossing the signal line from below zero to above, means a buy signal
- Crossing the signal line from above zero to below, means a sell signal
- you can change the period of signal line in settings panel
- Multiple moving averages with different periods and methods
- Ichimoku base line (Kijun-sen)
- MACD
- ADX
- Momentum
- CCI
- William's Percent range
- Stochastic
- Envelopes
- DeMarker
- Awesome





User didn't leave any comment to the rating