TrendDecoder Premium
- Indicators
- Christophe Pa Trouillas
- Version: 4.0
- Updated: 25 June 2024
- Activations: 10
Identify ranges | Get earliest signals of Trends | Get clear exits before reversal | Spot the Fibo levels the price will test
Non-repainting, non-delayed indicator - ideal for manual and automated trading - for all assets and all time units
5 copies left at $69 - then $99
After purchase, please contact me for recommended and personalised settings
Version MT4 - MT5 | Check our 3 steps MetaMethod to maximise your profits: 1.TrendDECODER 2.PowerZONES 3.BladeSCALPER
What is it about?
TrendDECODER is a concentrate of multiple innovations to make trend monitoring simple and easy.
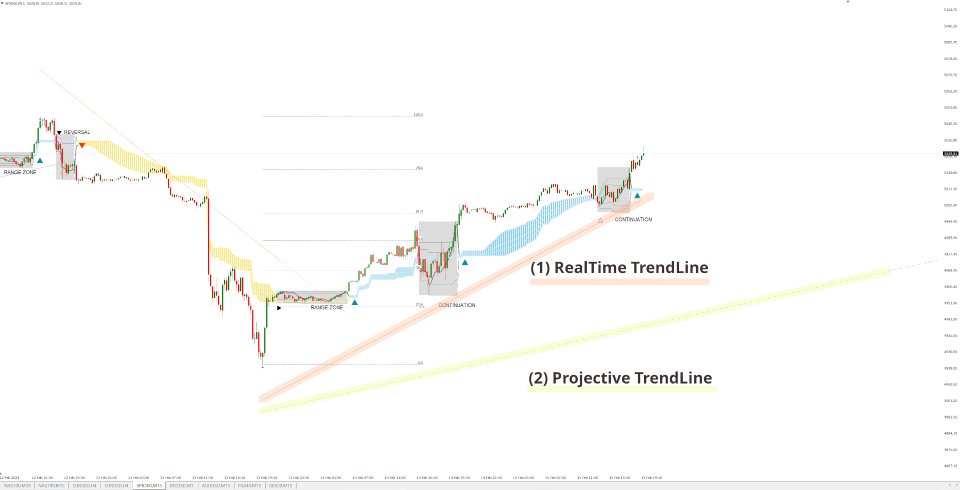
- With Projective TrendLine (Projective Trend Line) - speed reference of the upcoming trend
- With RealTime TrendLine vs. the Projective TrendLine - the market is accelerating or slowing down from the previous move in the same direction?
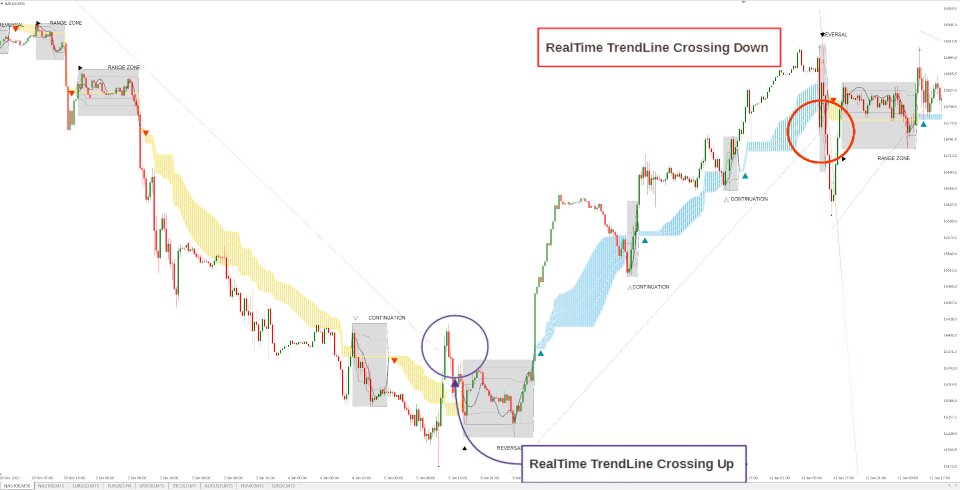
- With RealTime TrendLine Crossing - the trend is going off the rails
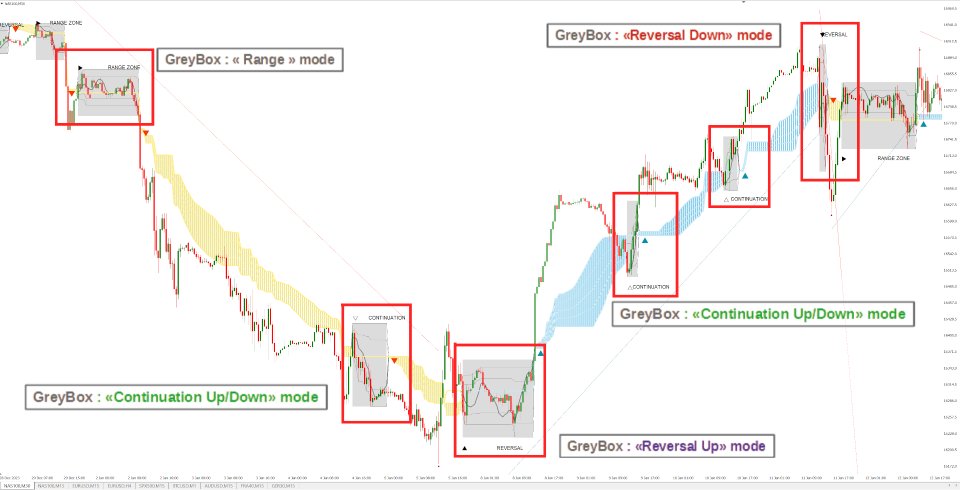
- With GreyBox - the market is no longer trending and enters a new transition sequence
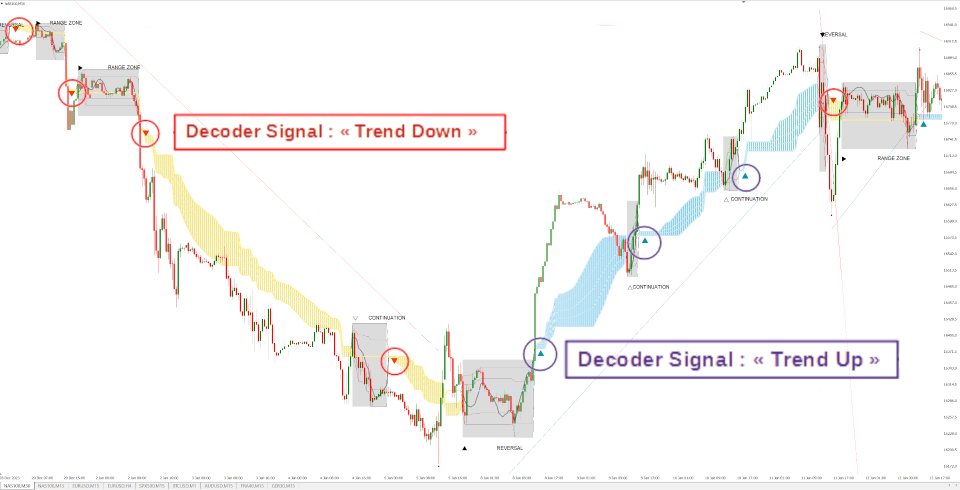
- With DecoderSignals & Blue/Orange Clouds© - get the new trend direction with the Blue/Orange Clouds as dynamic supports/resistances.
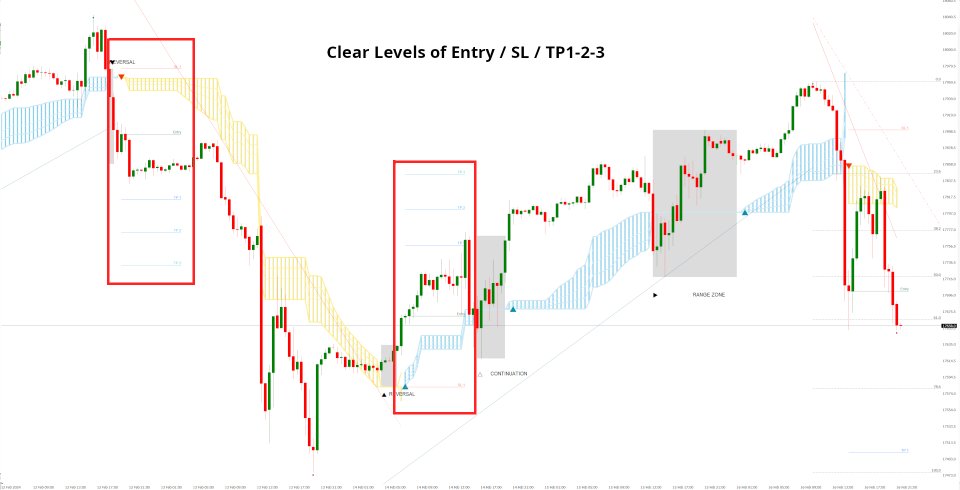
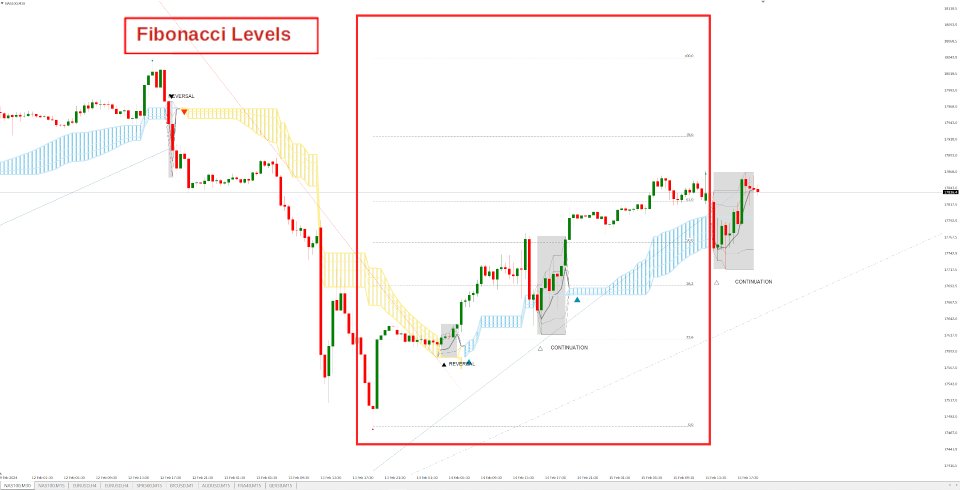
- With FiboLevels - immediately spot the price levels that the market will test
For which assets?
TrendDECODER is universal and works perfectly on all assets and time units.
However, always work on a multi-frame environment to minimize risk.
Concretely, how does it work and with which strategies?
Projective TrendLine (Projective trend line)
As soon as a new High/Low has been reached in the last movement, TrendDECODER draws a possible angle of the future movement, based on the slope of the last movement in the same direction.
The distance between the Projective Trend Line and the last Lowest (resp. Highest) gives you a probable price range deviation.
RealTime TrendLine (Real Time Trend Line)
As soon as the GreyBox has delivered its information, i.e. Range/Continuation/ReversalUp/ReversalDown, and a New High (resp. New Low) has been reached, the RealTime TrendLine© starts to plot and shows the angle of the new movement.
The angles of the Projective and the RealTime TrendLine can be identical, which tells you that the market is moving smoothly in a global consensus. This can be a smart trailing stop loss.
Or these angles are very different and that should call your attention. You might want to move to a higher time unit to get the full picture.
FiboLevels
As soon as a new trend is reported, the FiboLevels are automatically placed.
They are calculated on the last high and low of the previous movement.
---------------------------------------------------------------------------------------------------
Strategy #1: Early Trend Following: RealTime TrendLine Crossing (Real Time Trend Line Crossing)
With this simple tool, you get the very early signal of a likely reversal of the current trend, long before TrendDECODER Signal is displayed, after the GreyBox closes.
See ScreenShots.
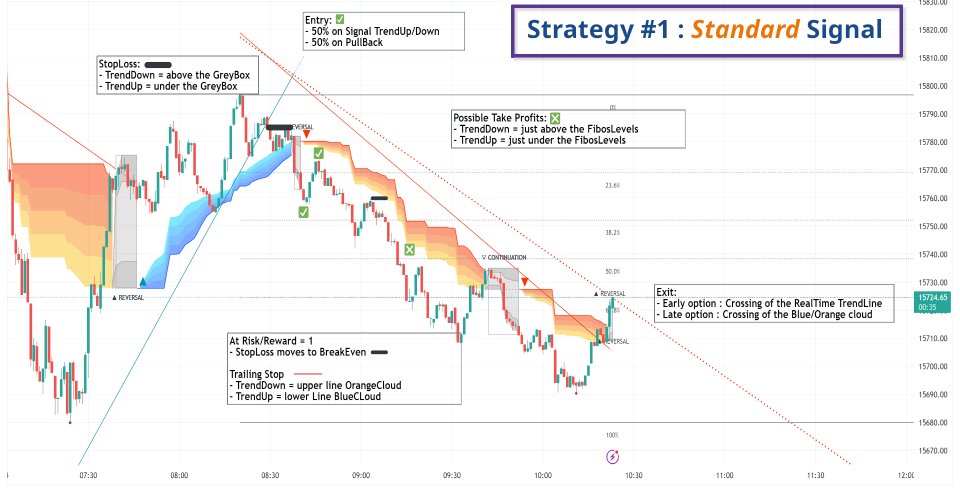
Strategy #1: Early Trend Following - Checklist
- Set up a multiple timeframe environment: Lower / Main / Upper time unit
- Check that the Upper and Main time units are moving in the same direction (TrendUp or TrendDown for both)
- Entry:
- Main time unit: wait for the GreyBox to open
- First Stop Loss:
- Place your SL below below the GreyBox (TrendUP) above (TrendDown)
- Trailing Stop:
- Move your SL just below the lower edge of the Blue Cloud (TrendUp) or the upper edge of the Orange Cloud (TrendDown)
- Take Profits:
- In a TrendUp, place your take profits just below the Fibos levels so you don't get knocked out (and above in a downtrend)
---------------------------------------------------------------------------------------------------
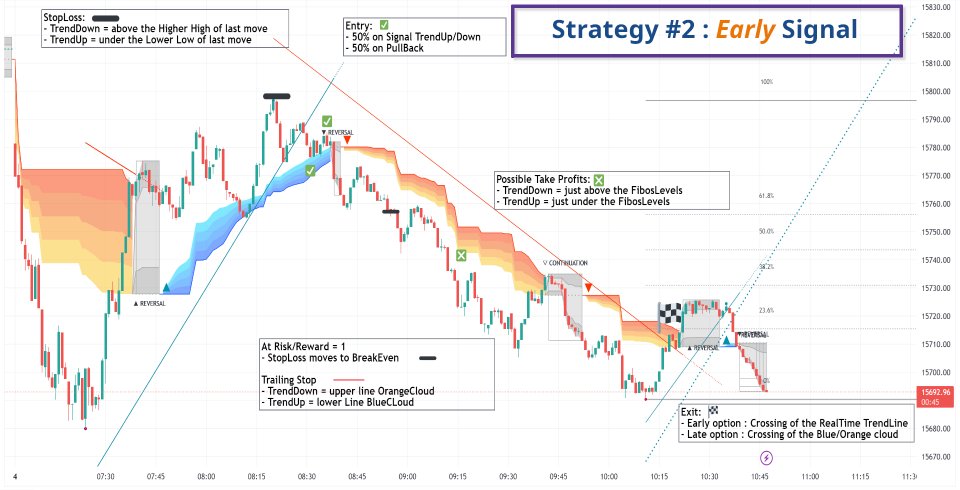
Strategy #2 : Trend following : DecoderSignals© & Blue/Orange Clouds© (Decoder Signals & Blue/Orange Clouds)
This is the moment we have been waiting for! The GreyBox announces the next probable movement and the trend is launched. The RealTime TrendLine guides us on the rhythm of this movement and the Blue/Orange Cloud indicates the support/resistance of this movement.
It will be wise not to enter the trend immediately when the signal appears as the price will most likely make a pullback towards the cloud first.
See ScreenShots.
Strategy #2: Trend Tracking - Checklist
- Define a multiple time frame environment: Lower / Main / Upper time unit
- Check that the Upper and Main time units are moving in the same direction (up or down for both)
- Entry:
- Main Time Frame: Check for the appearance of the "TrendUp Signal" or "TrendDown Signal."
- Buying "Market" on the signal can be risky as the price will often make a comeback to the cloud (Blue or Orange)
- A good option is to buy 1/2 of the position at the signal and the second 1/2 after the pullbac
- First Stop Loss: place your SL below the lower border of the GreyBox (for an expected TrendUp) or the upper border (for an expected TrendDown)
- Trailing Stop: move your SL just below the lower edge of the Blue Cloud (TrendUp) or the upper edge of the Orange Cloud (TrendDown)
- Take Profits: in a TrendUp, place your take profits just below the Fibos levels so you don't get pulled out (and above in a downtrend)





Very good