Volatility analyzer with alerts for MT4
- Indicators
- STE S.S.COMPANY
- Version: 1.1
- Activations: 10
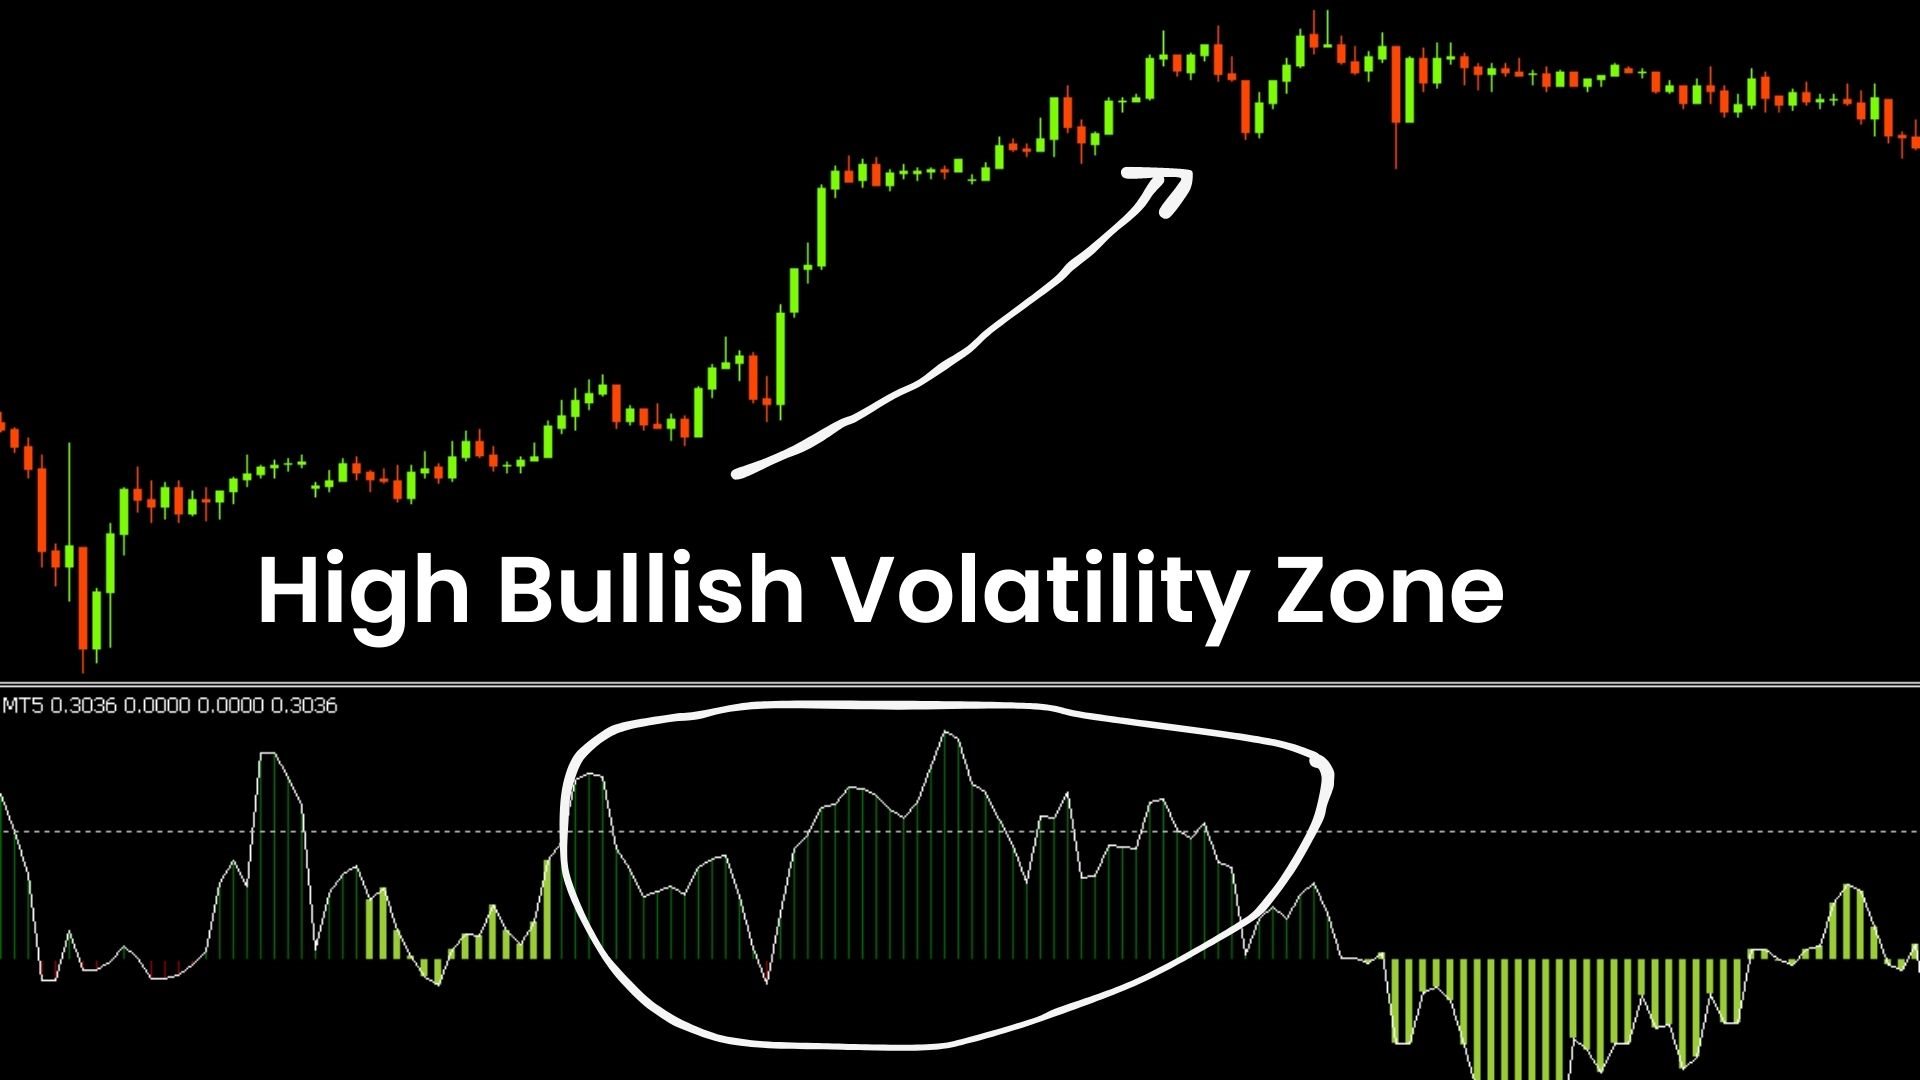
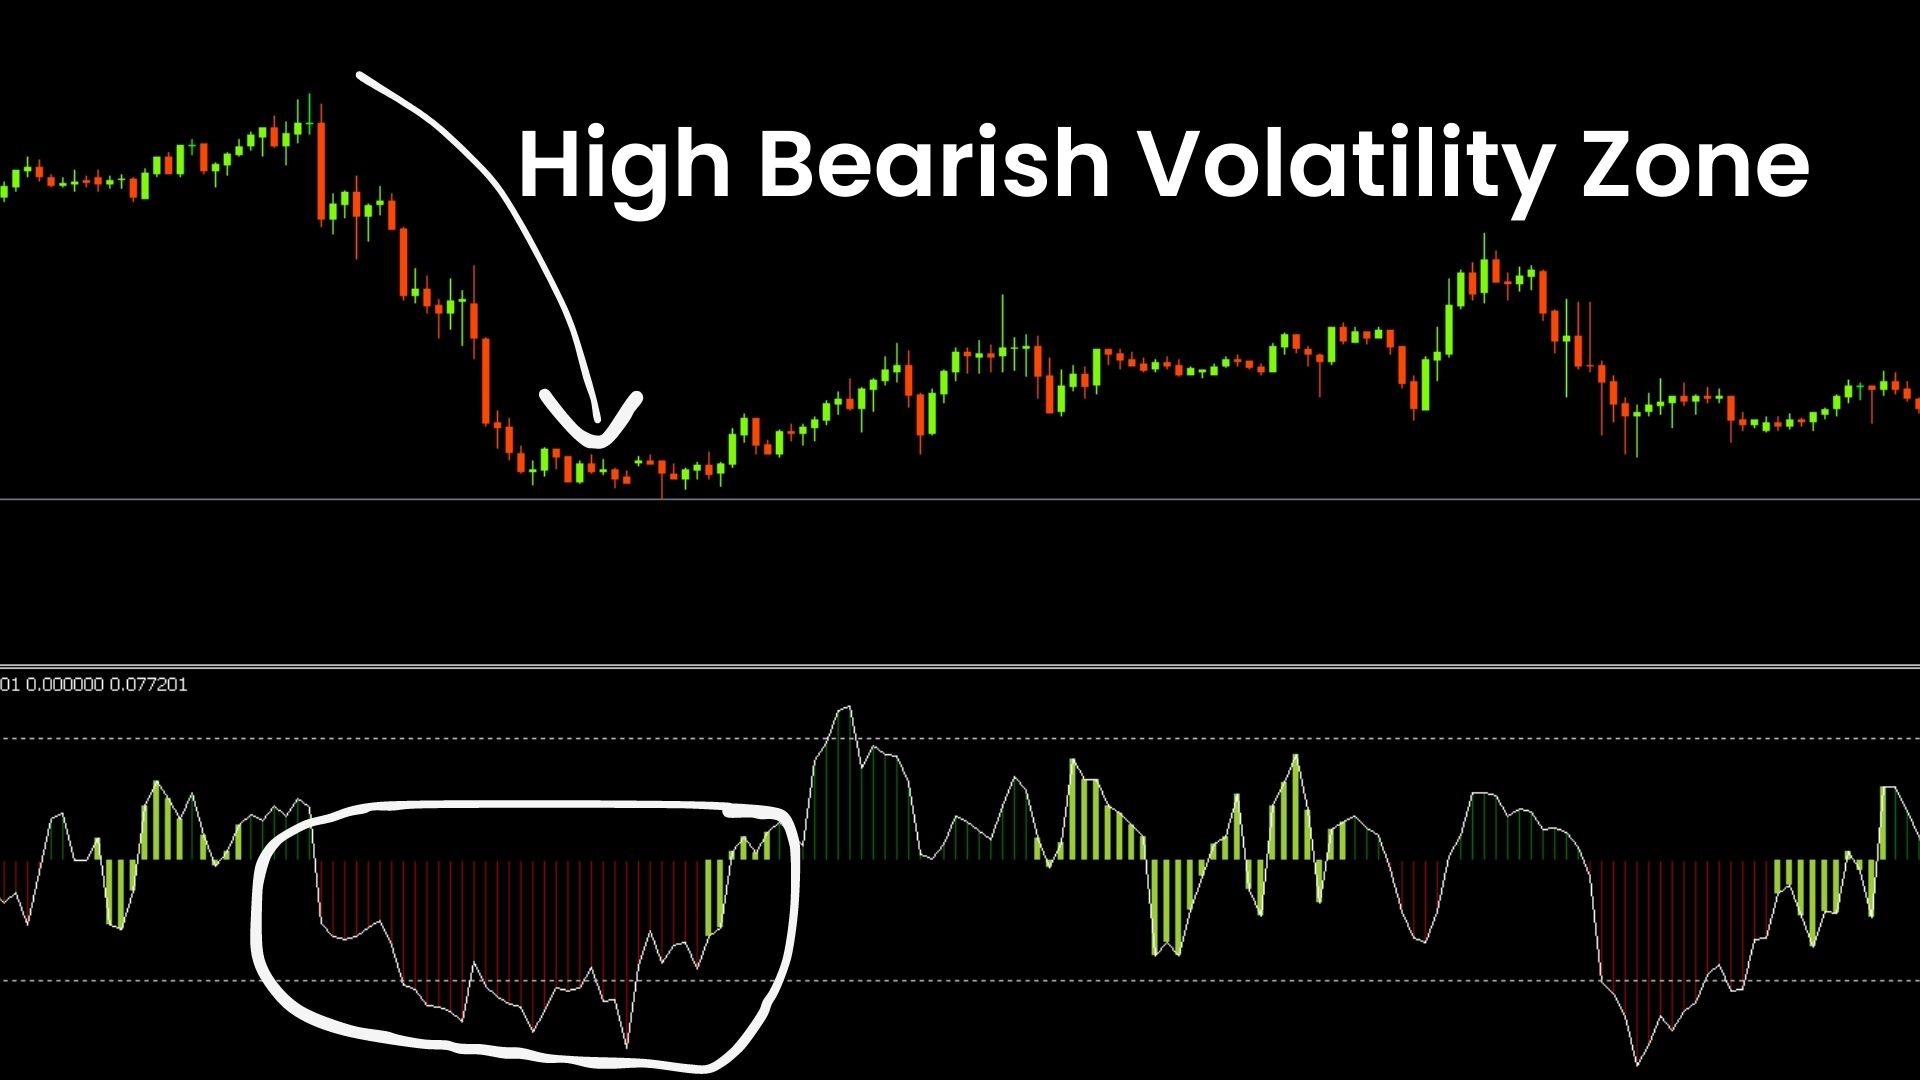
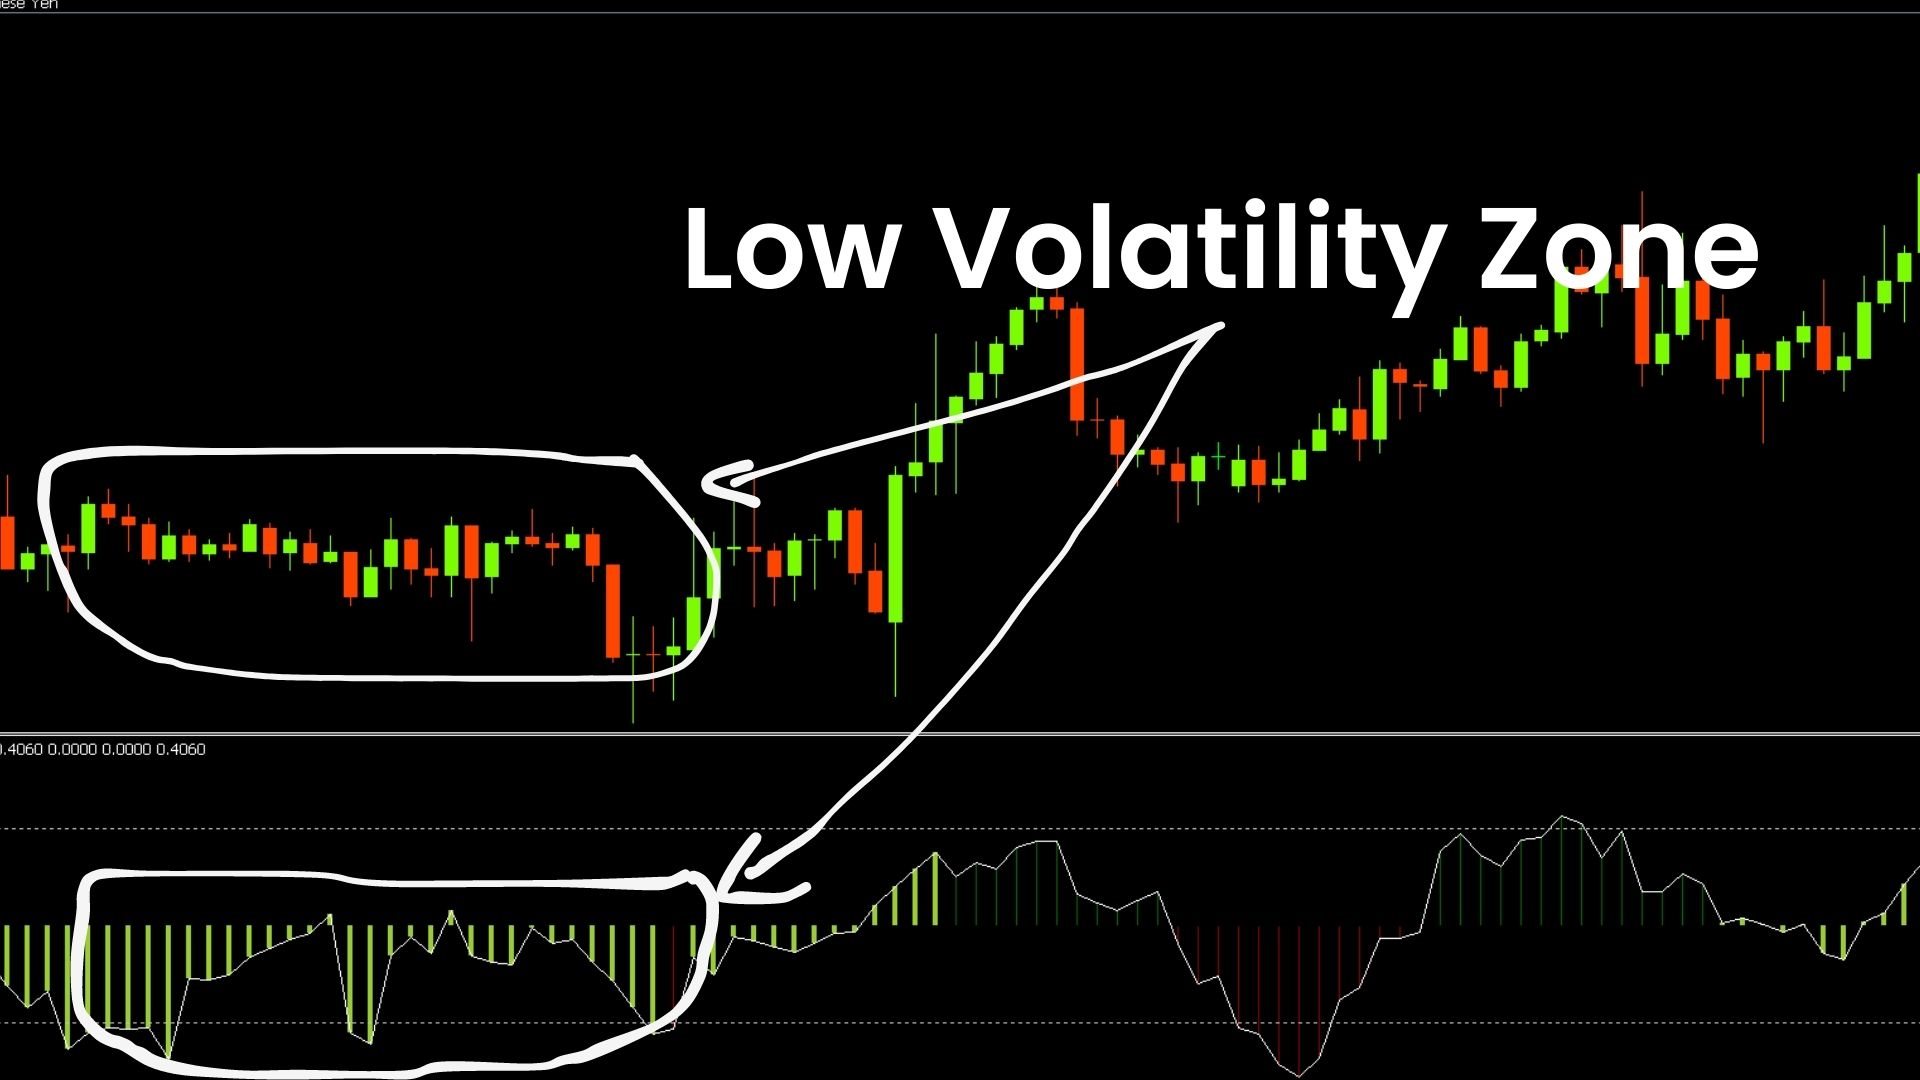
Volatility analyzer is a momentum indicator, which capitalizes on the tendency for price to break out strongly after consolidating in a tight trading range. The indicator also uses a momentum oscillator to show the expected direction of the move when the squeeze fires. This histogram oscillates around the zero line, increasing momentum above the zero line indicates an opportunity to purchase long, while momentum falling below the zero line can indicate a shorting opportunity.
Contact
Warning
All our indicators and tools and are available only via the official Metatrader Store ( MQL5 Market ).
Author
LIMITED TIME OFFER: All our premium indicators are available for only 50$, by accessing our MQL5 blog you will find all the details of our premium indicators. Click here.
Key features
- Sideways trend detector.
- Low Volatility detector.
- Bullish High and Bearish High Volatility detectors.
- Working with all timeframes and all pairs.
- Provide pop-up alerts and Push notification alerts.
Contact
If you have some questions or if you need help , please contact me via Private Message.
Warning
All our indicators and tools and are available only via the official Metatrader Store ( MQL5 Market ). Premium Indicators
By accessing to our MQL5 profile, you can find all our free and premium indicators. To access to our profile click here
Author
SAYADI ACHREF , fintech software engineer and founder of Finansya Lab.