CalcFlat
- Indicators
- Ivan Simonika
- Version: 1.0
- Activations: 5
CalcFlat is a flat indicator.
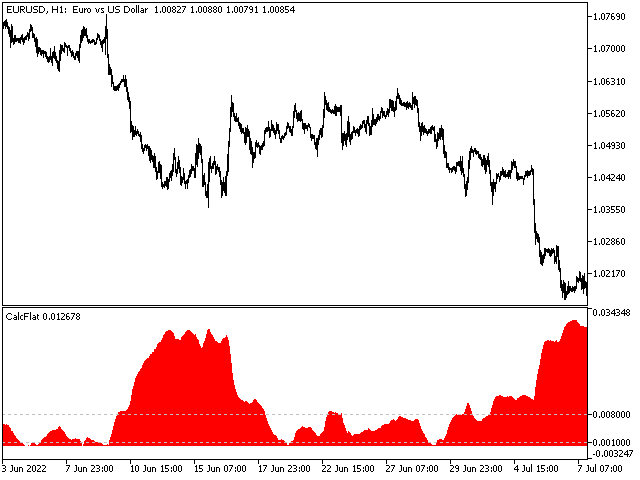
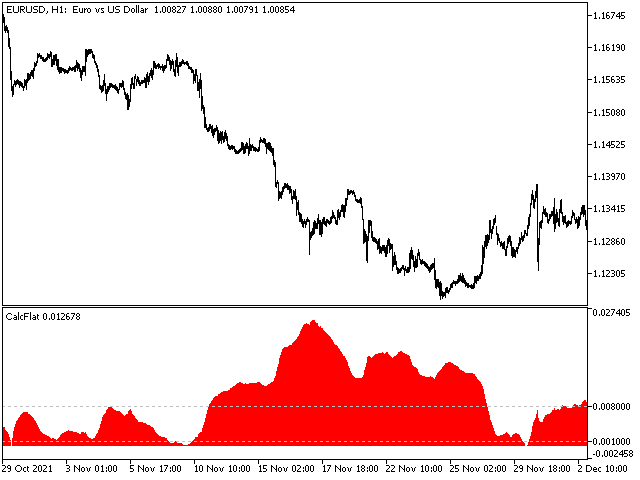
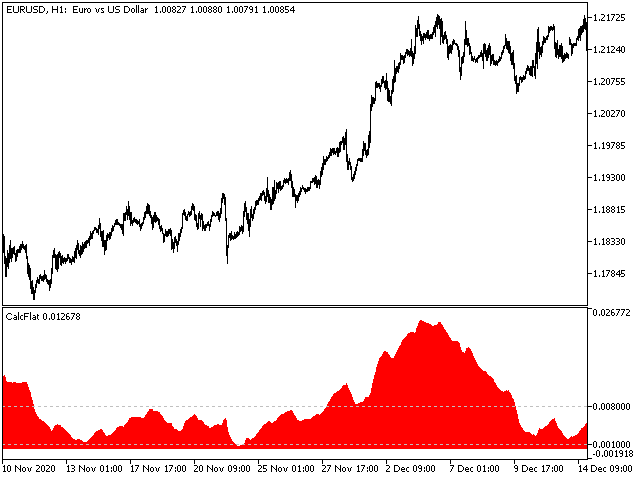
At first glance, a simple indicator, but if you look at the screenshots for people who are not specialists, it may seem that the indicator is not very informative. But in fact, the indicator is very informationally active. It needs to be adjusted for each instrument and each timeframe. Very flexible in the settings there are two key settings, but they can significantly change the results of the display of the indicator. In addition to the main histogram, the indicator has two levels. It reads as follows. The larger the histogram, the less pronounced the flat and the more trendy market movement. With the FixedMaximum level, it is necessary to react to the exit from the flat and fix the trend (not the beginning, but already the fixation of the current trend). The FixedMinimum level can fix a deep flat. You can react to the indicator readings according to your strategy.
Main theses:
- When the histogram breaks through the FixedMaximum level upwards, the trend movement is fixed, not the beginning, but the position after the beginning and approximately up to half of the trend movement.
- When the histogram breaks through the FixedMinimum level down, the trend stops completely and the market rolls back to previous positions (before the trend began).
Options:
- Slow - Forming parameter of the indicator No. 1.
- Fast is the forming parameter of indicator No. 2.
- OnFixed – Fix below the specified levels as indicator limits.
- FixedMaximum - maximum level (each timeframe has its own).
- FixedMinimum – minimum level (each timeframe has its own).
