UR VolumeTrend MT5
- Indicators
- Krzysztof Jan Debski
- Version: 3.10
- Updated: 16 May 2024
- Activations: 5
UR VolumeTrend MT5
UR VolumeTrend MT5 is the clearest volume indicator showing the ongoing trend in terms of volume. Works perfectly with other indicators just like UR TrendExhaustion to signal local tops and bottoms.
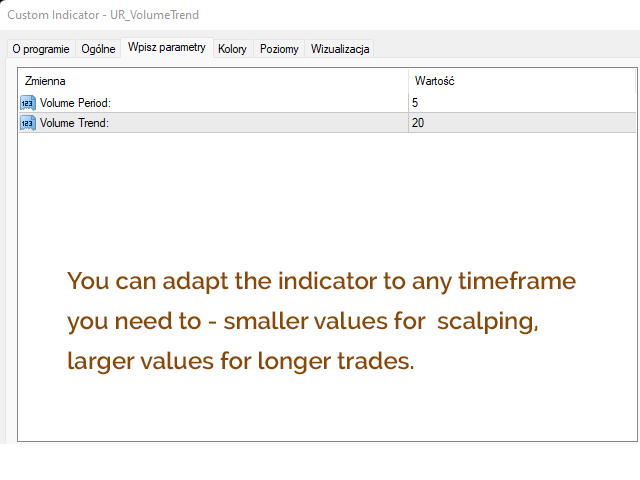
- Limited to just 2 parameters - the higher values, the longer trends it will show.
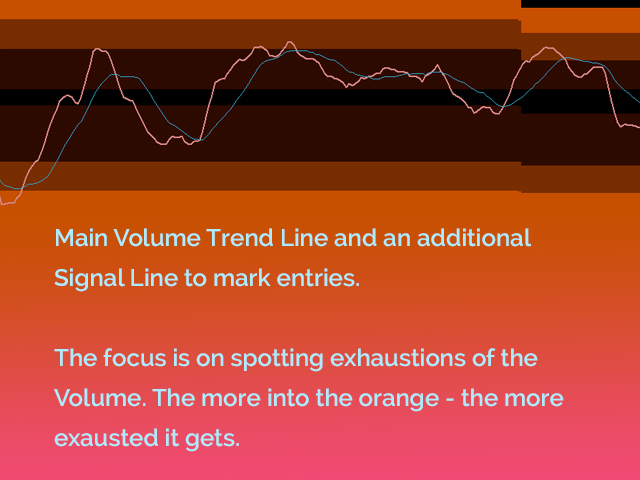
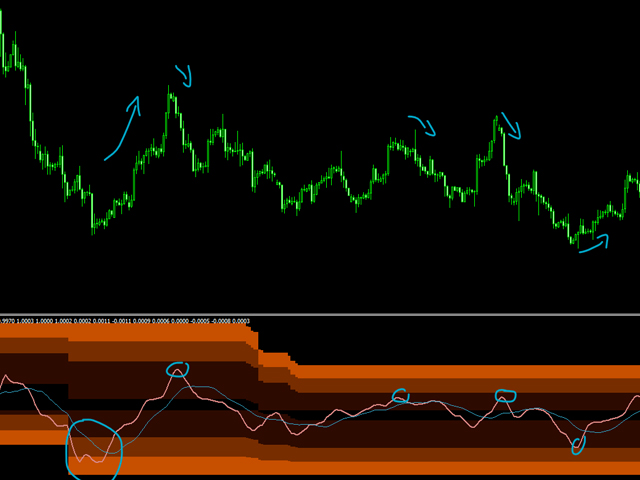
- Gradient extremes show possible exhaustions of volume to catch a potential reversal.
- Two lines - The Volume trend and It's average.
- The best advantage: Easy and adjusted to all assets.
There is a special telegram chat on which you can stay up-to-date with the tools updates and also send request if you feel there is something missing!
Why UR VolumeTrend MT5 ?
All will agree Volume is key to catch trends. This Oscillator is a sum of all my volume tools compressed into one easy-to-use indicator. It shows Positive/Negative volume in a friendly-to-see way. The Interface behind shows if the volume is possibly getting exhausted compared to the past - or if it's gonna push to new levels.
How to use UR VolumeTrend MT5 ?
See description below to be more familiar with it:
- Volume Period: The higher the value, the bigger trends it will try to catch
- Volume Trend: This additional line shows potential reversal entries based solely on volume
DISPLAY
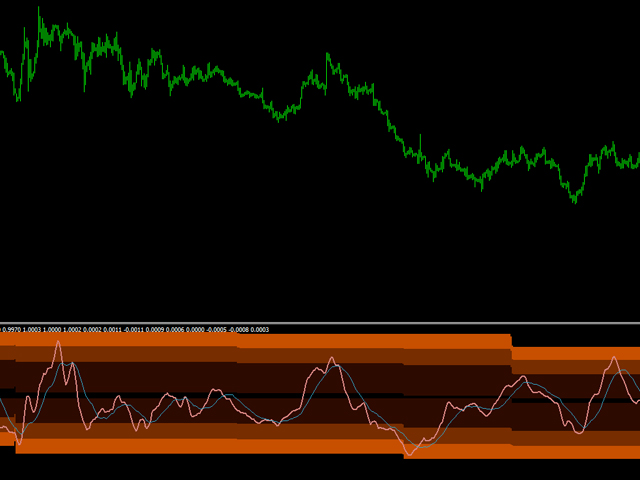
- Gradient interface: Shows level extremes based on the past.
- Volume Main Line: Shows if the volume is bullish *above 0* or bearish *below 0* and how strong the volum gets. Hovering around 0 means market has no volume.
- Volume Trend Line: Shows an Average of the Volume to have a clearer picture of potential entries and reversals.
ADDITION
- All of my tools are working best when assembled. Meaning the accuracy of entry points is way better if used with UR TrendExhaustion, UR DivergenceSpotter or/and UR HighsAndLows.
WWW -> https://urtradingcoder.carrd.co
Twitter -> https://twitter.com/URTradingCoder
Facebook -> https://www.facebook.com/profile.php?id=61559349091899
YouTube -> https://www.youtube.com/channel/UCihthoKQYrhj91jkUO8B1kg
MQL Store -> https://www.mql5.com/en/users/youreacoder/seller