• Overview
  • Reviews (8)
  • Comments (24)
  • What's new

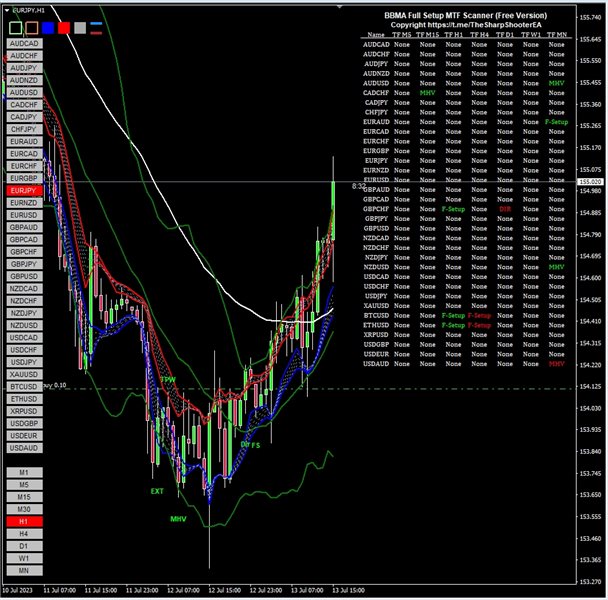
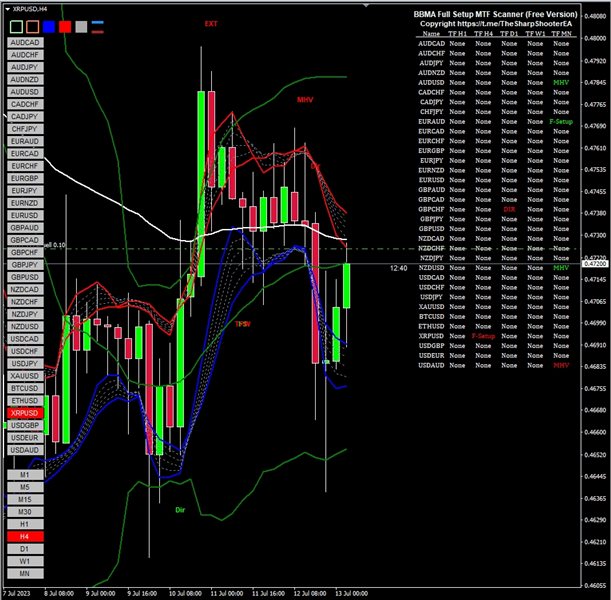
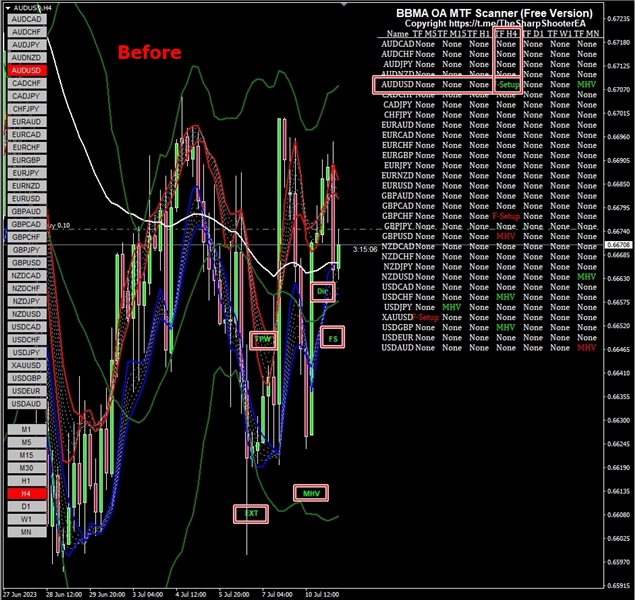
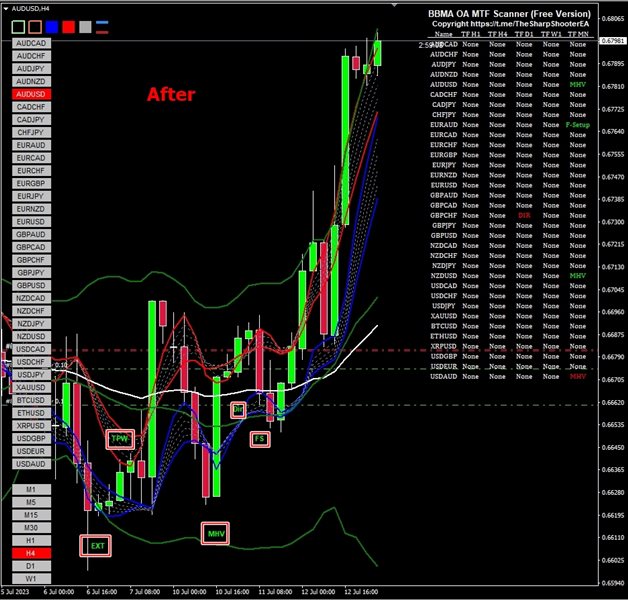
BBMA Oma Ally Labels

4.6
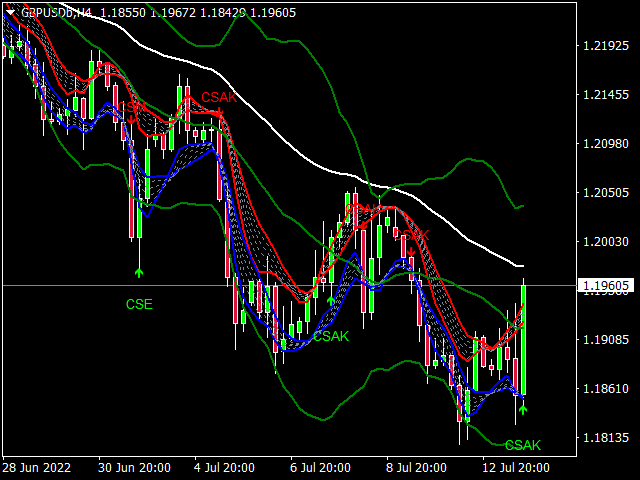
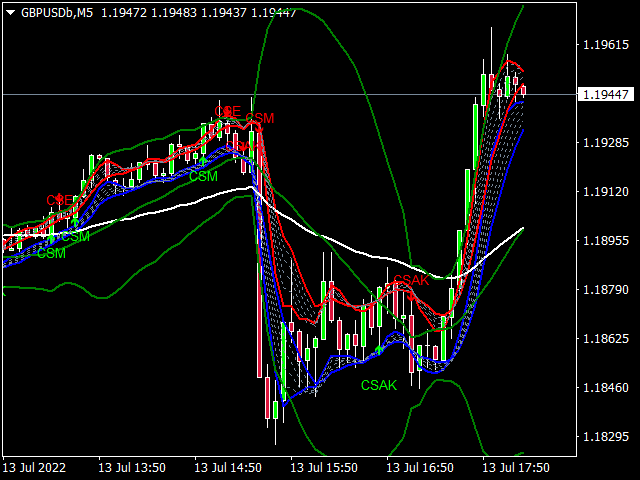
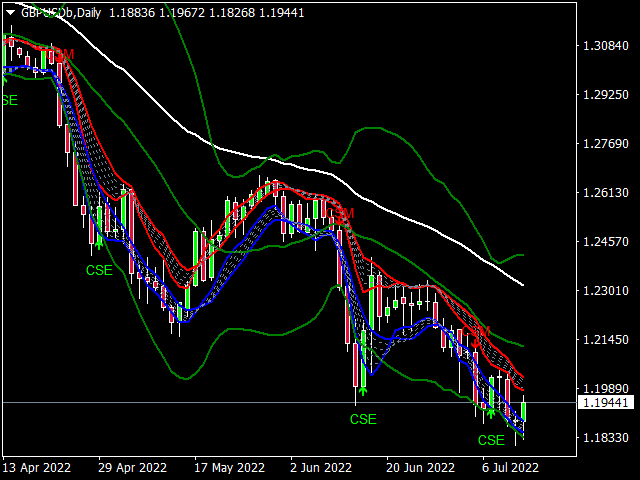
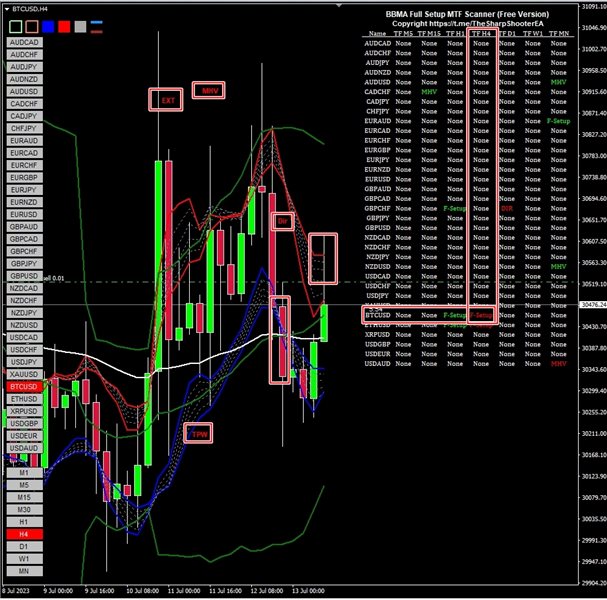
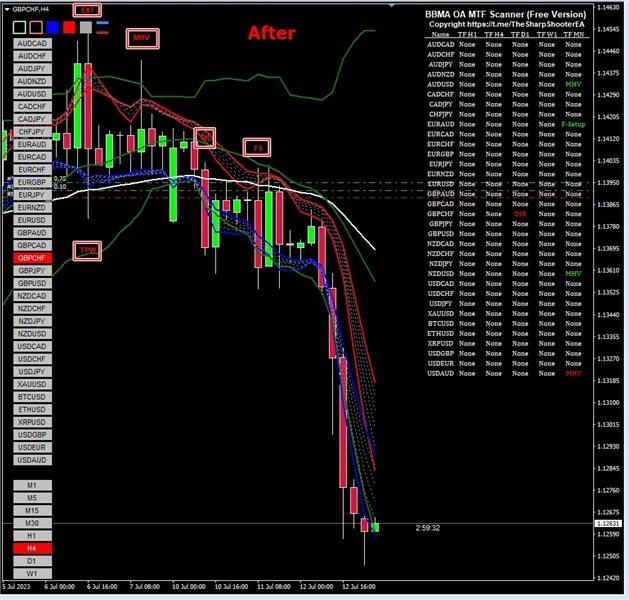
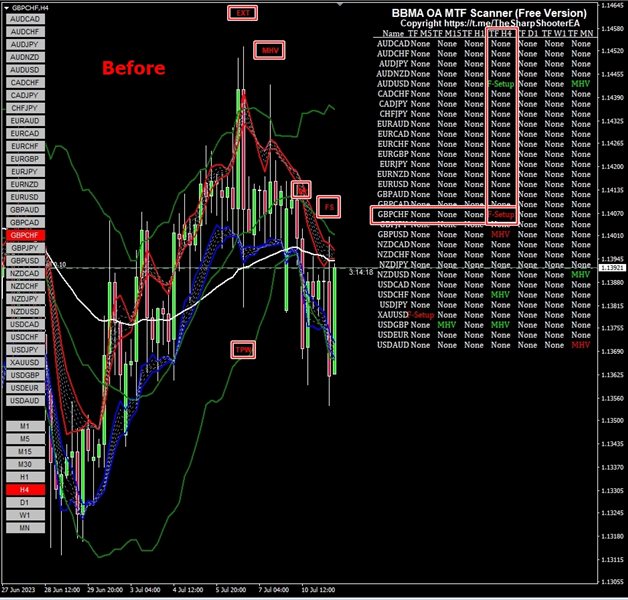
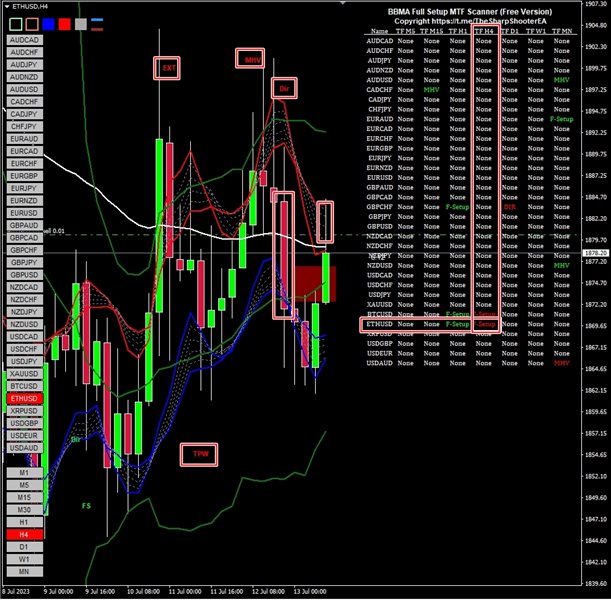
indicators to facilitate analysis based on Oma Ally's BBMA strategy by displaying CSAK (CSD), CSM and Extreme labels on the chart
1. Displays the Bollinger Band line
2. LWMA 5-10 High and Low
3. EMA 50
4. Fibonacci
5. MHV . area

6. Alert & Show labels

BBMA consists of the use of 2 indicators:

  1. Moving Averages
  2. Bollinger Bands


BBMA consists of 3 types of entries:

  1. Extreme
  2. MHV
  3. Re-Entry


Moving Average Settings:

There are 5 MAs used in the system:

2 High Moving Averages, 2 Low Moving Averages and 1 Exponential Moving Average.

  1. MA 5 HIGH
  2. MA 10 HIGH
  3. MA5 LOW
  4. MA10 LOW
  5. EXPONENTIAL MA 50

Bollinger Band Settings:

Period = 20

Shift = 0

Deviations = 2

Apply to = Close


Understanding the Moving Averages:

  1. Downtrend: MA 5/10 HIGH is above the candles
    • MA 5/10 LOW goes through the candles
    • MA 10 HIGH is above MA 5 HIGH
    • MA 10 LOW is above MA 5 LOW
  2. Uptrend: MA 5/10 LOW is below the candles
    • MA 5/10 HIGH goes through the candles
    • MA 5 HIGH is above MA 10 HIGH
    • MA 5 LOW is above MA 10 LOW


Note :

The above MA are only used to help determine trends use the MA50 on a daily chart to help and get confirmation of the trend. When the market is above the MA50 price is said to be in an uptrend. When the market is below the MA50 price is said to be in a down trend.

MAs can also act as support and resistance.


Understanding Bollinger Bands:

Downtrend: Candles are below the MID BB

Uptrend: Candles are above the MID BB

MID BB: MID BB acts as support and resistance as well.


BBMA Entry Types:

  1. Extreme
  2. MHV
  3. Re-Entry
  4. CS Direction
  5. CS Momentum

"In-depth knowledge of BBMA Oma Ally strategy is needed"

More complete features are in the following products

BBMA Oma Ally Analyzer Dashboard EA


Reviews 8
sunhuanhuana
106
sunhuanhuana 2024.06.11 11:30 
 

非常好的指标,五星好评 ,但是对于其中在图表上显示的这些字符理解不夠,希望你可给注释一下,万分感谢!TPW.MHV.CSE.CSM.CSAK.EXT.FS.Dir.

Super_Bejo
24
Super_Bejo 2023.02.06 06:01 
 

sangat sangat membantu Kang

Abraham Correa
2557
Abraham Correa 2022.07.15 22:17 
 

Interesting strategy; completely valid, my respects!

Recommended products
Supreme HmaSignal
Abdulkarim Karazon
4 (1)
The Supreme HmaSignal indicator is an indicator for trend trading , its main character is the hull moving average colored line , and secondary is buy and sell arrows , arrows are fair but the main focus is on the colored hma , this indicator does not repaint or back paint or delay its signals. if you like this indicator please check my Supreme Trendhisto:   here   , and my Supreme Diamond indicator :   here Parameters:  HMA Period HMA Smoothing HMA Price (close/open) Signal Period (Arrows)
FREE
MWC Ratio
Joerg Hamann
4 (1)
The Commitments of Traders Ratio Indicator is one of these things you never thought about it before you really see the magic behind it. The indicator shows the Ratio of long/short positions released by the CFTC once a week. If you have a look on the Sreenshot you can see two (three) zones of interest. Zone 1: The Switches (Red -> Green, Green -> Red) Zone 2: MA cross Zone 3: If you combine this with the COX indicator an additional zone will appear. You also can experiment with Ratio crossing M
FREE
Индикатор отображает размер бара и его направление. ---------------------------------------- Цвета гистограммы: * Красный - Медвежий бар. * Зелёный - Бычий бар. * Серый - Цена открытия и цена закрытия равны. * Синяя линия - скользящая средняя. ---------------------------------------- Параметры: - Type of Calculation - Тип расчёта ( Low to High, Open to Close ) - Moving Avarage - Период скользящей средней
FREE
DeM Signal AM
Andriy Matviyevs'kyy
This indicator displays the moment when the DeMarker oscillator crosses its smoothed value. If the DeMarker oscillator crosses its smoothed value, it is a signal of a trend change. The signal is given after the end of the formation of the candle. The signal is confirmed when the price crosses the high/low of the bar on which the signal was given. The indicator does not redraw. Custom Parameters: DeM_Period (>1) - DeMarker indicator period; MA_Period - period for smoothing DeMarker indicator va
FREE
PointsVsBars
Stanislav Korotky
This indicator provides a statistical analysis of price changes (in points) versus time delta (in bars). It calculates a matrix of full statistics about price changes during different time periods, and displays either distribution of returns in points for requested bar delta, or distribution of time deltas in bars for requested return. Please, note, that the indicator values are always a number of times corresponding price change vs bar delta occurred in history. Parameters: HistoryDepth - numbe
FREE
EMA Separation Coefficient reflects the separation between short-term and long-term exponential moving average trend resistance, as well as the direction of the current movement. Pay attention to potential crossover points when the coefficient approaches zero, this may indicate an upcoming breakout or reversal. Wait for confirmation of the trend before entering the trade, and exit when the coefficient forms a max (for calls) or a min (for puts). This is a small tool to help visualize the differe
FREE
FREE FOR A LIMITED TIME ONLY!!! The Ultimate Indicator For Trading Trend This indicator clearly shows you the strength of the market in one direction or the other, which means that you can trade knowing you are either with or against the market. When used in conjunction with the +3R principles you are sure to have some serious results. The +3R Principles Routine - This is when you trade and how often  Rules - This is the rule you follow  Risk:Reward - This is the percentage amount of your accoun
FREE
APriceChannel is a modification of the standard Price_Channel indicator. The EA draws 2 levels - the upper level shows the price High for the specified period of time, the lower level shows the price Low for the same period. In addition to the period, you can set vertical offset in points to widen the channel up and down. This prevents false breakouts of current support/resistance levels. Inputs Period - time period in bars - the number of bars to calculate the price High/Low. Offset up and do
FREE
Extremum by trend
Anton Iudakov
5 (2)
Looking for entry points along the local trend without repaint! Arrows indicate entry points. Based on classic indicators. The indicator is easy to use. Settings Наименование Описание Frequency factor Signal frequency. The less, the more often. This affects the quality. Recommendations Recommended for use on major currency pairs. Timeframe from m5, m15, m30 Subscribe to my telegram channel, where we discuss intraday trading, ideas, indicators, etc., a link in my profile contacts.
FREE
Hidden Stochastic
Christian Ricard
4 (1)
This indicator allows to hide Stochastic  oscillator  (on all MT4 timeframes) from a date define by the user, with a vertical line (Alone) or a panel (with "Hidden Candles"). Indicator Inputs: % K Period % D Period  Slowing Apply To Method Information on "Stochastic Oscillator" indicator is available here:   https://www.metatrader4.com/en/trading-platform/help/analytics/tech_indicators/stochastic_oscillator ************************************************************* Hey traders!!  Give me your
FREE
AW Flexible Fractals
AW Trading Software Limited
4 (5)
The indicator analyzes the price structure of fractals and identifies possible reversal points of market dynamics. Perfect when used in combination with other types of indicators. Advantages: Works on all instruments and timeseries, Doesn't redraw its results, Customizable colors of indicator elements, Works well with any trending strategy, Adjusting the strength of fractals. MT5 version -> HERE / Our news ->  HERE Strategy: AW Flexible Fractals   is an indicator that indicates signals
FREE
Hidden MACD
Christian Ricard
This indicator allows to hide MACD oscillator (on all MT4 timeframes) from a date define by the user, with a vertical line (Alone) or a panel (with "Hidden Candles"). Indicator Inputs: Fast EMA Period Slow EMA Period  Signal SMA Period Apply To Information on "MACD" indicator is available here:   https://www.metatrader4.com/en/trading-platform/help/analytics/tech_indicators/macd ************************************************************* Hey traders!!  Give me your feeds!  We are a community h
FREE
The MT4 indicator that we are describing is designed to provide traders with an alert, notification, and email when Fibonacci levels are crossed. The Fibonacci levels are calculated based on the zigzag indicator, which helps to identify potential trend reversals in the market. When the indicator detects that a price has crossed a Fibonacci level, it will trigger an alert and send a notification to the trader's MT4 mobile app. Additionally, the indicator can be configured to send an email to the
FREE
To get access to MT5 version please click here . This is the exact conversion from TradingView: "Candle body size" by "Syamay". This is a light-load processing indicator. This is a non-repaint indicator. Buffers are available for processing in EAs. All input fields are available. You can message in private chat for further changes you need. Thanks for downloading
FREE
Supreme Direction
Abdulkarim Karazon
4 (1)
Supreme Direction is an indicator based on market volatility , the indicator draws a a two lined channel with 2 colors above and below price , this indicator does not repaint or back-paint and signal is not delayed. how to use : long above purple line , short below golden line. Parameters : channel period ========================================================
FREE
AIS MT4 INDICATOR 5 ALL INCLLUSIVE SET !!!!!!!!!!!!!!!!!!!!!!!!!!!!!!!!!!!!!!!!!!!!!!!!!!!!!!!!!!! ! ! ATTENTION ! LIMITATION OF FREE OFFER PERIOD IS IMPLICIT ! !   ! CONFIRMATION 2024-08-20 20:00                           ! ! !!!!!!!!!!!!!!!!!!!!!!!!!!!!!!!!!!!!!!!!!!!!!!!!!!!!!!!!!!! GUIDE CHAPTER 1 IMPORTANT INFORMATION <1> THIS INDICATOR IS ONE OF THE SERIES OF NEW AIS INDICATORS AIS MT4 INDICATOR 1 =ADVANCED CLASSIC= AIS MT4 INDICATOR 2 =MULTIFRAMES= AIS MT4 INDICATOR 3 =LIN
FREE
In a departure from the conventional approach, traders can leverage the bearish engulfing candlestick pattern as a buy signal for short-term mean reversion trades. Here's how this alternative strategy unfolds: The bearish engulfing pattern, (typically signaling a reversal of bullish momentum) , is interpreted differently in this context. Instead of viewing it as a precursor to further downward movement, we perceive it as an indication of a potential short-term bounce or mean reversion in prices.
FREE
Ribbon Trend
Sutthichai Mungdee
5 (3)
This indicator is a simple tool to spot a possible trend. When the ribbon below the price bars, It will turn to Green color and the trend is seen to be bullish When the   ribbon above the price bars, it will turn to Red color and the trend is seen to be bearish. It can be used a either Entry Signal Exit Signal or trailing stop, so it is very versatile. By default color : Green is UP trend and Red is Down trend and this work perfect with Bar4Colors.ex4
FREE
This indicator prepared by using 1311,2840 days moving average and Calculates the Envelopes.    This system can be used for 15M time frame.     This system is for Long term and profitable.    Signals are shown as arrows. as an optional,    you can set a voice alarm or email notification    You can fins our other products from link : https://www.mql5.com/en/users/drbastem/seller    Also, you can ask all your questins from email : haskayafx@gmail.com or mobile : +90 530 867 5076 or @MehmetBastem
QualifiedEngulfing
Ashkan Hazegh Nikrou
QualifiedEngulfing Is Free Version Of ProEngulfing Indicator  ProEngulfing Is Paid Version Of This Indicator  Download It Here . What is Different Between free and paid version of ProEngulfing ?  Free version has limitation of One Signal Per Day Join Koala Trading Solution Channel in mql5 community to find out the latest news about all koala products, join link is below : https://www.mql5.com/en/channels/koalatradingsolution Introducing QualifiedEngulfing   – Your Professional Engulf Pattern In
FREE
Multi RsIBB MT4
Mansour Babasafary
5 (1)
A combined indicator of two famous indicators: RSI , Bollinger Bands Can be used in all currency pairs Can be used in all time frames with many signals Very simple and fast to use Description: This indicator is made from the combination of RSI and Bollinger Bands indicators As you can see, it shows good signals and is worth using and testing We hope you are satisfied with this indicator Settings: show past show candle: Displays the number of candles that the indicator calculates. For
FREE
Chartos
Victor Golovkov
Trend indicator with oscillator. Displays price area between two moving averages and an oscillator. An uptrend is indicated in red, a downtrend in blue. Settings: Slow MA Period - Slow MA period Fast MA Period - Fast MA period Smoothed Data - Smoothing data Show Area MA - Display MA price areas Show Oscillation - Display MA oscillation Move Oscillation to Slow MA - Display an oscillator on a slow MA Color Up - Uptrend color Color Down - Downtrend color Size Arrow - The size of the oscillator ic
FREE
Stochastic Plus
Oleg Borisov
4.5 (2)
Stochastic Plus is a visual indicator designed for both beginners and professionals.    Developed using Stochastic and Laguerre and the principle of three screen.     Stochastic Plus helps: correctly evaluate the current market movement; find optimal entry points; do not rush to close profitable orders and increase profit     Stochastic Plus works very well with AmericanDream indicator (see screenshot).    May be used with any currency and timeframe.
FREE
Momentum Breakout SW
Mohamed Hassan Mohamed Hassan Alsherbiny
When prices breakout resistance levels are combined with momentum oscillator breaks out its historical resistance levels then probability emerges to record farther prices. It's strongly encouraged to confirm price breakout with oscillator breakout since they have comparable effects to price breaking support and resistance levels; certainly short trades will have the same perception. Concept is based on find swing levels which based on number of bars by each side to confirm peak or trough and in
FREE
MT4 Sessions Indicator
Part-time Day Trader
5 (3)
This indicator shows trading sessions using colored candles. It's made for volume profile and supply/demand traders to quickly see when specific candles are formed during different times or trading sessions. Take a look at the screenshots for a usage example. Core Features: Different colors for bullish and bearish candles, allowing users to distinguish between bullish/bearish candles.
FREE
FxSProWPR
Sergiy Podolyak
The FxSProWPR oscillator generates signals for trend confirmation, which can also nbe used to confirm the emergence of new trends. Indicator Parameters NumberBars - the number of bars to display the indicator. Too many bars may significantly slow down the operation of the trading terminal. SignalAlert - an Alert notifying of a trend. SignalSound - sound alert to notify of a trend. The sound will be played once the histogram exceeds the level of 15. Rules to confirm position entry Green histo
FREE
AW Super Trend
AW Trading Software Limited
3 (2)
AW Super Trend -This is one of the most popular classic trend indicators. It has a simple setting, allows you to work not only with the trend, but also displays the stop loss level, which is calculated by this indicator. Benefits: Instruments:   Currency pairs , stocks, commodities, indices, cryptocurrencies. Timeframe: М15 and higher. Trading time: Around the clock. Shows the direction of the current trend. Calculates the stop loss. It can be used when working with trading. Three types of not
FREE
Today is the Day
Alexander Shienkov
5 (3)
This simple information indicator shows the name of the current day and past working days, months and years. On the concept of time and timeframe It is common knowledge that a timeframe is a time interval considered in technical analysis of free financial markets, during which the price and other market data changes occur when the price charts are plotted. In the MetaTrader 4 trading terminal, these periods are separated by vertical dashed line, which can be enabled or disabled by simply press
FREE
Note: this product is a free limited version of the full featured product Currency Timeframe Strength Matrix . It only includes AUD, CAD, CHF currencies instead of all 8 currencies. It includes only 5S, 1M, 5M time frames instead of all 8 (5S, 1M, 5M, 15M, 30M, 1H, 4H, 1D). What is it? The Currency TimeFrame Strength Matrix is a simple and comprehensive Forex map that gives a snapshot of what is happening in the Forex market at the very present time. It illustrates the strength and momentum
FREE
Buyers of this product also purchase
Gann Made Easy
Oleg Rodin
4.83 (92)
Gann Made Easy is a professional and easy to use Forex trading system which is based on the best principles of trading using the theory of W.D. Gann. The indicator provides accurate BUY and SELL signals including Stop Loss and Take Profit levels. You can trade even on the go using PUSH notifications. PLEASE CONTACT ME AFTER PURCHASE TO GET MY TRADING TIPS PLUS A GREAT BONUS! Probably you already heard about the Gann trading methods before. Usually the Gann theory is a very complex thing not only
Bull versus Bear
Mohamed Hassan
4.83 (6)
Official Release price of $65 for the first 48 /50   copies ( 2 copies left). Next price is $120 !  Send us a message after your purchase to receive more information on how to get your  BONUS  for FREE  that works in great combination with Bull vs Bear ! Bull versus Bear is an easy-to-use Forex indicator that gives traders clear and accurate signals based on clear trend retests . Forget about lagging indicators or staring at charts for hours because  Bull vs Bear provides real-time entries
- Real price is 80$ - 40% Discount ( It is 49$ now ) Contact me for instruction, add group and any questions! Related Products:  Bitcoin Expert , Gold Expert Introduction The breakout and retest strategy is traded support and resistance levels. it involves price breaking through a previous level.  The break and retest strategy is designed to help traders do two main things, the first is to avoid false breakouts. Many false breakouts start with a candlestick that breaks out of a level but ends w
FX Volume
Daniel Stein
4.58 (33)
Visit our all-new   Stein Investments Welcome Page   to get the latest information, updates and trading strategies. FX Volume is the FIRST and ONLY volume indicator that provides a REAL insight into the market sentiment from a broker's point of view. It provides awesome insights into how institutional market participants, like brokers, are positioned in the Forex market, much faster than COT reports. Seeing this information directly on your chart is the real game-changer and breakthrough solut
Atomic Analyst
Issam Kassas
5 (2)
First of all Its worth emphasizing here that this Trading Indicator is   Non-Repainting , Non Redrawing and Non Lagging Indicator   Indicator, Which makes it ideal from both manual and robot trading.  User manual: settings, inputs and strategy . The Atomic Analyst  is a PA Price Action Indicator that uses Strength and Momentum of the price to find a better edge in the market. Equipped with Advanced filters which help remove noises and false signals, and Increase Trading Potential. Using Multipl
Gold Stuff
Vasiliy Strukov
4.89 (241)
Gold Stuff is a trend indicator designed specifically for gold and can also be used on any financial instrument. The indicator does not redraw and does not lag. Recommended time frame H1. At it indicator work full auto  Expert Advisor EA Gold Stuff. You can find it at my profile. Contact me immediately after the purchase to get   personal bonus!  You can get a free copy of our Strong Support and Trend Scanner indicator, please pm. me! Settings  and manual here   SETTINGS Draw Arrow - on off. dra
Trend Punch
Mohamed Hassan
4.95 (20)
Halloween Promotion   until Sunday 11-03-24  with a 40% discount on the original price!  This indicator is unstoppable when combined with our other indicator called  Support & Resistance . After purchase, send us a message and you will get it   for  FREE as a BONUS! Introducing Trend Punch , the revolutionary forex trend indicator that will transform the way you trade! Trend Punch is uniquely designed to provide precise buy and sell arrows during strong market trends, making your trading d
Black dragon indicator
Ramil Minniakhmetov
4.86 (114)
The trend detection indicator will compliment any strategy and can also be used as an independent tool. IMPORTANT! Contact me immediately after the purchase to get instructions and a bonus! Recomedation for work with indicator #8 Benefits  Easy to use; does not overload the graphic wih unnecessary information. The ability to use as filter for any strategy. Contains bult -in dynamic levels of cupport and resistange,  which can be used both, for profit taking, and for settings up stop-losses. The
Scalper Inside PRO
Alexey Minkov
4.73 (56)
An exclusive indicator that utilizes an innovative algorithm to swiftly and accurately determine the market trend. The indicator automatically calculates opening, closing, and profit levels, providing detailed trading statistics. With these features, you can choose the most appropriate trading instrument for the current market conditions. Additionally, you can easily integrate your own arrow indicators into Scalper Inside Pro to quickly evaluate their statistics and profitability. Scalper Inside
FX Power MT4 NG
Daniel Stein
5 (13)
Trading GOLD, and currencies, with the dog walk strategy  - super smart Trading GOLD, and currencies, with the breakout strategy  - super easy Visit our all-new   Stein Investments Welcome Page   to get the latest information, updates and trading strategies. FX Power MT4 NG  is the next generation of our long-time very popular currency strength meter, FX Power.  And what does this next-generation strength meter offer? Everything you have loved about the original FX Power  PLUS GOLD/XAU stre
FX Levels is an exceptionally accurate support and resistance indicator that merges the traditional Lighthouse method with an innovative dynamic approach, functioning flawlessly across all trading symbols. This includes currency pairs, indices, stocks, or commodities. FX Levels identifies reversal points and displays them on the chart, which can be ideally utilized as profit targets in your trading activities. In developing FX Levels, we have used our extensive experience with brokers and the v
The Stochastic Basket Currency Strenght  brings the Stochastic indicator to a new level.  Expanding the boundaries of TimeFrames and mono-currency analysis, the SBCS take the movements of each currency that composes the cross and confront them in the whole basket of 7 crosses.  The indicator works with any combination of AUD, CAD, CHF, EUR, GBP, JPY, NZD, USD pairs and with full automation takes in account every stochastic value (main line) for the selected Time Frame.  After that, the indicator
Trend Pulse
Mohamed Hassan
5 (4)
Halloween Promotion   for   24 hours only   with a   40%   discount on the original price!  $̶6̶5̶  $39 ONLY!  Please contact me after purchase to immediately get your PDF strategy + documentation for Trend Pulse !  Introducing Trend Pulse , a unique and robust indicator capable of detecting bullish, bearish, and even ranging trends! Trend Pulse uses a special algorithm to filter out market noise with real precision. If the current symbol is moving sideways, Trend Pulse will send you a
TPSproTREND PrO
Roman Podpora
4.79 (19)
TPSpro TRENDPRO  - is a trend indicator that automatically analyzes the market and provides information about the trend and each of its changes, as well as giving signals for entering trades without redrawing! The indicator uses each candle, analyzing them separately. referring to different impulses - up or down impulse. Exact entry points into transactions for currencies, crypto, metals, stocks, indices!  Version MT5             DETAILED DESCRIPTION              R ecommended to use with an indi
Stratos Pali
Michela Russo
5 (1)
Stratos Pali Indicator   is a revolutionary tool designed to enhance your trading strategy by accurately identifying market trends. This sophisticated indicator uses a unique algorithm to generate a complete histogram, which records when the trend is Long or Short. When a trend reversal occurs, an arrow appears, indicating the new direction of the trend. Important Information Revealed Leave a review and contact me via mql5 message to receive My Top 5 set files for Stratos Pali at no cost! D
Trend Screener
STE S.S.COMPANY
4.81 (88)
Unlock the Power of Trends Trading with the Trend Screener Indicator: Your Ultimate Trend Trading Solution powered by Fuzzy Logic and Multi-Currencies System! Elevate your trading game with the Trend Screener, the revolutionary trend indicator designed to transform your Metatrader into a powerful Trend Analyzer. This comprehensive tool leverages fuzzy logic and integrates over 13 premium features and three trading strategies, offering unmatched precision and versatility. LIMITED TIME OFFER : Sup
Reversal-Arrow: Identify Reversal Points with Precision and Reliability Reversal-Arrow is an advanced indicator designed to assist traders of all levels in spotting potential trend reversals. It focuses on providing clear and visual signals to help you better understand market context, reducing uncertainty and facilitating decision-making. Reversal-Arrow is optimized specifically for XAUUSD and XAUEUR pairs on 1-minute, 5-minute, and 15-minute timeframes, where it performs at its best. However,
TPSpro RFI Levels
Roman Podpora
4.82 (22)
A key element in trading is zones or levels from which decisions to buy or sell a trading instrument are made. Despite attempts by major players to conceal their presence in the market, they inevitably leave traces. Our task was to learn how to identify these traces and interpret them correctly. INSTRUCTIONS    RUS    -    ENG            R ecommended to use with an indicator   -   TPSpro  TREND PRO -  Version MT5 Main functions: Displaying active zones for sellers and buyers! The indicator show
Dynamic Forex28 Navigator
Bernhard Schweigert
5 (2)
Dynamic Forex28 Navigator - The Next Generation Forex Trading Tool CURRENTLY 49% OFF. Dynamic Forex28 Navigator is the evolution of our long-time, popular indicators, combining the power of three into one: Advanced Currency Strength28 Indicator (695 reviews) + Advanced Currency IMPULSE with ALERT (520 reviews) + CS28 Combo Signals (recent Bonus) Details about the indicator   https://www.mql5.com/en/blogs/post/758844 What Does The Next-Generation Strength Indicator Offer? Everything you loved
Market Reversal Alerts
LEE SAMSON
4.19 (113)
LIMITED TIME SALE - 30% OFF, WAS $49, NOW $35! Profit from market structure changes as price reverses and pulls back. The market structure reversal alert indicator identifies when a trend or price move is approaching exhaustion and ready to reverse. It alerts you to changes in market structure which typically occur when a reversal or major pullback are about to happen. The indicator identifies breakouts and price momentum initially, every time a new high or low is formed near a possible exhaust
LIMITED TIME SALE - 30% OFF, WAS $49, NOW $35! This dashboard is an alert tool for use with the market structure reversal indicator. It's primary purpose is to alert you to reversal opportunities on specific time frames and also to the re-tests of the alerts (confirmation) as the indicator does. The dashboard is designed to sit on a chart on it's own and work in the background to send you alerts on your chosen pairs and timeframes. It was developed after many people requested a dash to monitor
This dashboard shows the latest available harmonic patterns for the selected symbols, so you will save time and be more efficient / MT5 version . Free Indicator:   Basic Harmonic Pattern Comparison of "Basic Harmonic Pattern" vs. "Basic Harmonic Patterns Dashboard" Indicators Feature Basic Harmonic Pattern Basic Harmonic Patterns Dashboard Functionality Detects and displays harmonic patterns on a single chart Searches multiple symbols and timeframes for harmonic patterns, displays result
LIMITED TIME SALE - 30% OFF, WAS $49, NOW $35! Automatically draw support and resistance levels PLUS propulsion candle gaps on your chart, so you can see where price is likely to head next and/or potentially reverse. This indicator is designed to be used as part of the position trading methodology taught on my website (The Market Structure Trader) and displays key information for targeting and potential entries. MT version available here:  https://www.mql5.com/en/market/product/97973 There are
Scalper Vault
Oleg Rodin
5 (27)
Scalper Vault is a professional scalping system which provides you with everything you need for successful scalping. This indicator is a complete trading system which can be used by forex and binary options traders. The recommended time frame is M5. The system provides you with accurate arrow signals in the direction of the trend. It also provides you with top and bottom signals and Gann market levels. The indicator provides all types of alerts including PUSH notifications. PLEASE CONTACT ME AFT
Gold Channel is a volatility-based indicator, developed with a specific timing algorithm for the XAUUSD pair, which consists of finding possible corrections in the market. This indicator shows two outer lines, an inner line (retracement line) and an arrow sign, where the theory of the channel is to help identify overbought and oversold conditions in the market. The market price will generally fall between the boundaries of the channel. If prices touch or move outside the channel it is a tra
Currently 20% OFF ! Best Solution for any Newbie or Expert Trader! This dashboard software is working on 28 currency pairs plus one. It is based on 2 of our main indicators (Advanced Currency Strength 28 and Advanced Currency Impulse). It gives a great overview of the entire Forex market plus Gold or 1 indices. It shows Advanced Currency Strength values, currency speed of movement and signals for 28 Forex pairs in all (9) timeframes. Imagine how your trading will improve when you can watch the e
Currency Strength Wizard is a very powerful indicator that provides you with all-in-one solution for successful trading. The indicator calculates the power of this or that forex pair using the data of all currencies on multiple time frames. This data is represented in a form of easy to use currency index and currency power lines which you can use to see the power of this or that currency. All you need is attach the indicator to the chart you want to trade and the indicator will show you real str
First of all Its worth emphasizing here that this Trading Tool is Non-Repainting Non-Redrawing and Non-Lagging Indicator Which makes it ideal for professional trading . Online course, user manual and demo. The Smart Price Action Concepts Indicator is a very powerful tool for both new and experienced traders . It packs more than 20 useful indicators into one combining advanced trading ideas like Inner Circle Trader Analysis and Smart Money Concepts Trading Strategies . This indicator focuses on
CURRENTLY 26% OFF Best Solution for any Newbie or Expert Trader! This Indicator is a unique, high quality and affordable trading tool because we have incorporated a number of proprietary features and a new formula. With only ONE chart you can read Currency Strength for 28 Forex pairs! Imagine how your trading will improve because you are able to pinpoint the exact trigger point of a new trend or scalping opportunity? User manual: click here That's the first one, the original! Don't buy a worthle
Ultimate Gold Advisor for MetaTrader 4 The Ultimate Gold Advisor is an advanced technological tool designed to optimize the trading experience on MetaTrader 4. Created to meet the needs of experienced traders, this indicator combines precision, sophisticated analysis, and versatile functionality, offering support for informed trading decisions. Ideal for gold trading but also applicable across a wide range of assets, the Ultimate Gold Advisor can help you improve your market strategies. What ma
More from author
BBMA Oma Ally Signals Scanner (BBMA Oma Ally Analyzer Dashboard EA) This is a multi-pair and multi scanner dashboard to find the key signal of BBMA Oma Ally Strategy BBMA consists of the use of 2 indicators: Moving Averages Bollinger Bands BBMA consists of many types of entries: Reentry Extreme Rejection EMA50 GAP (EMA50 to Upper/Lower BB) MHV Full Setup (CSE>TPW>MHV>Direction>Reentry) There are many multi timeframe signals based on this strategy. RRE (Reentry - Reentry - Extreme) REE (Reentry
This is a Multi pair and Multi time frame dashboard. The founder of the system is Mr. Oma Ally, which is a system based from Bollinger Band and Moving Average(BBMA). BBMA consists of the use of 2 indicators: Moving Averages Bollinger Bands BBMA consists of 3 types of entries: Extreme MHV Re-Entry Rejection EMA50 This Dashboard Help you to scan current Extreme, Reentry setup, Rejection EMA50 and also MHV How to read signals: find the same color in 3 different timeframes in succession For exam
FREE
Filter:
sunhuanhuana
106
sunhuanhuana 2024.06.11 11:30 
 

非常好的指标,五星好评 ,但是对于其中在图表上显示的这些字符理解不夠,希望你可给注释一下,万分感谢!TPW.MHV.CSE.CSM.CSAK.EXT.FS.Dir.

azizbintarti
14
azizbintarti 2023.09.18 03:48 
 

pls advise what is FS

Moch Ramdhan
6898
Reply from developer Moch Ramdhan 2023.09.19 10:43
It is Full Setup/Complete Cycle
First reentry after CSAK/CSM
Indah Hikmawati
18
Indah Hikmawati 2023.07.14 08:28 
 

ni coba tak pasang, cuman untuk labelnya kok nggak muncul ya bang

Moch Ramdhan
6898
Reply from developer Moch Ramdhan 2023.07.14 08:34
Aktifkan di dalam setingan nya
Super_Bejo
24
Super_Bejo 2023.02.06 06:01 
 

sangat sangat membantu Kang

Moch Ramdhan
6898
Reply from developer Moch Ramdhan 2023.03.31 23:08
alhamdulillah, salam profit ya kang
amin13eko
434
amin13eko 2023.02.02 17:15 
 

User didn't leave any comment to the rating

Moch Ramdhan
6898
Reply from developer Moch Ramdhan 2023.03.31 23:08
thank you
musyafaa
29
musyafaa 2022.12.13 21:58 
 

User didn't leave any comment to the rating

Moch Ramdhan
6898
Reply from developer Moch Ramdhan 2023.03.31 23:08
glad to know that, cheers up
Jaydeep Jaganbhai Patel
322
Jaydeep Jaganbhai Patel 2022.07.20 14:04 
 

User didn't leave any comment to the rating

Moch Ramdhan
6898
Reply from developer Moch Ramdhan 2023.03.31 23:09
my pleasure
Abraham Correa
2557
Abraham Correa 2022.07.15 22:17 
 

Interesting strategy; completely valid, my respects!

Moch Ramdhan
6898
Reply from developer Moch Ramdhan 2022.07.19 02:54
may be useful
Reply to review
Version 2.10 2024.07.04
Fixing some bugs
Added button to change pairs & timeframe
Added full setup pattern on chart
Version 1.70 2023.08.26
Fixing some bugs
Version 1.60 2023.07.13
Added Full Setup label (CSE>TPW>MHV>Direction>FS)
Version 1.50 2022.07.20
Fixing some bugs in displaying Moving Average lines