Volatility Vision modern
- Indicators
- Pavel Bereznichenko
- Version: 1.2
- Activations: 10
Volatility Vision: Essential for Forex and Stock Markets
Discover Volatility Vision: Your Trading Revolution
Perfect for Both Beginners and Expert Traders
Easy Start Guide: Learn how to use it effectively with our User Manual.
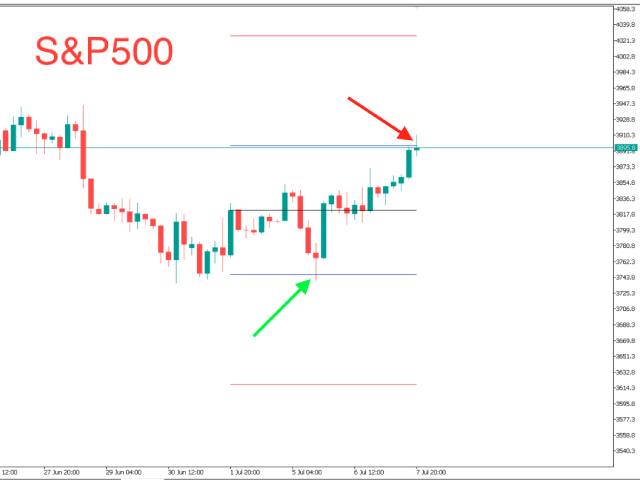
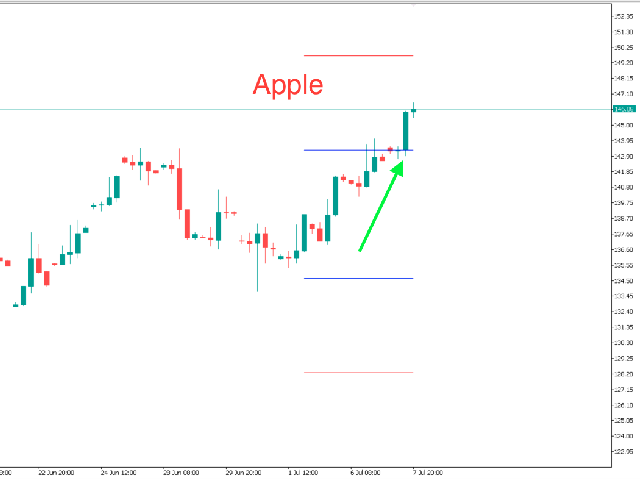
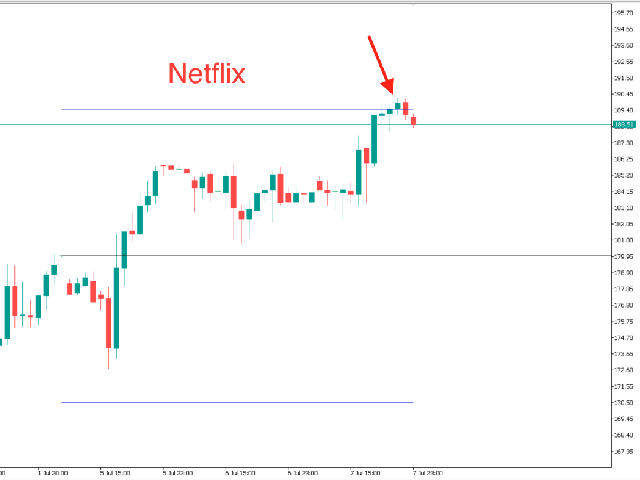
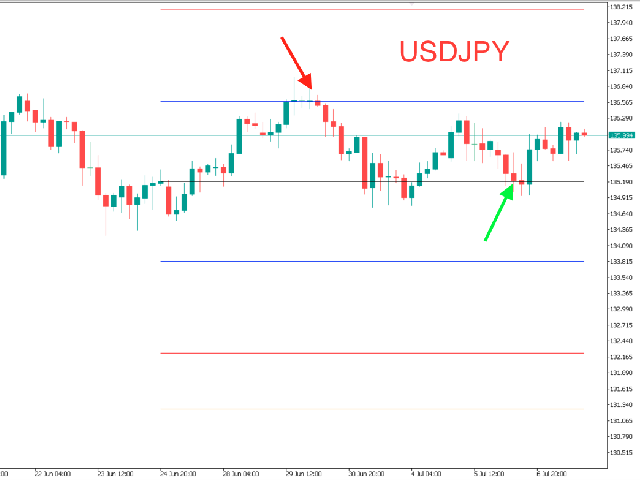
The Volatility Vision indicator is a powerful tool that maps out precise volatility levels on your charts. This versatile tool is essential for integrating into your trading strategy, compatible across all currency pairs and stock markets.
Utilize volatility thresholds to manage your trades within the week confidently.
Advantages of Volatility Vision
- Accuracy Enhanced: Significantly reduces false positives common with Stochastic Oscillators.
- Early Signals: Captures trading signals sooner than the RSI, helping you seize missed opportunities.
- Market Leading: Offers proactive insights before the MACD can respond.
- Dependability: Avoids the common pitfalls of false signals from the CCI.
Effortless Configuration
Input the ATR value to start (default is 15). All levels are fixed for consistent analysis; switch timeframes to refresh data.
Indicator Guide
- Blue Line: Daily volatility.
- Red Line: Weekly volatility.
- Orange Line: Monthly volatility.
Pair Volatility Vision with the conventional ATR for more strategic opportunities. Enhance your trading strategy today!
Acquire the Indicator Now: Visit the Market
Installation is straightforward, setting you up for immediate success!
Important: Due to static value limitations, the indicator is only testable for the first week on platforms.