TIL Candle Volume Heatmap for MT4
- Indicators
- Viktor Macariola
- Version: 1.0
- Activations: 20
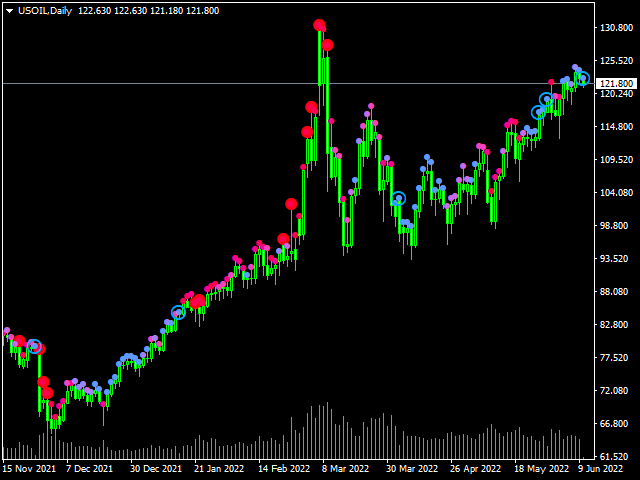
Trading Indicator Lab’s Candle Volume Heatmap for MT4 merges volume with price by applying gradient-colored dots on the bars. It can also detect bars that have the most volume and the least volume.
Gradient Coloring
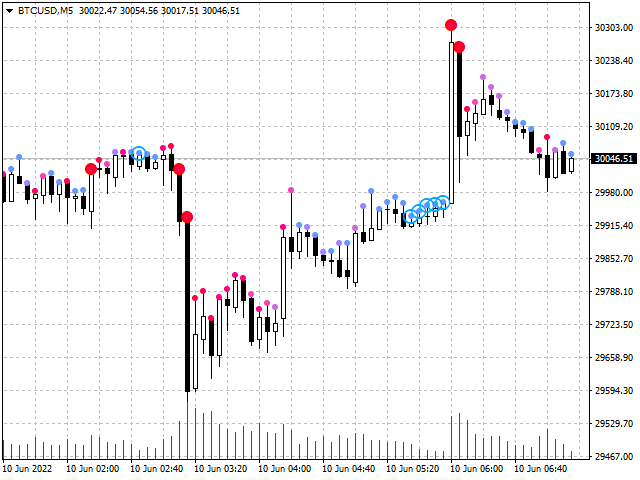
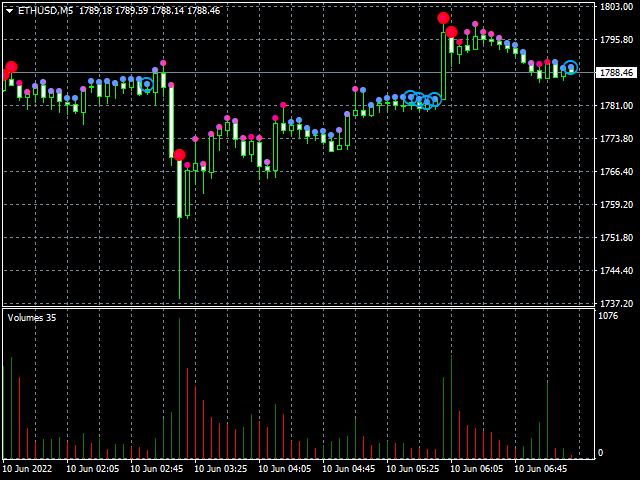
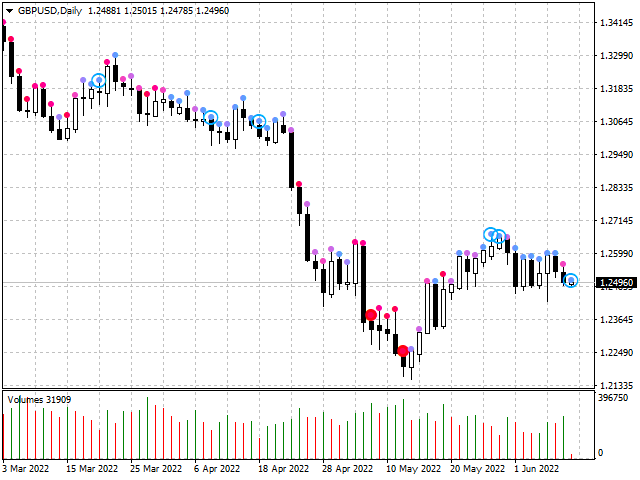
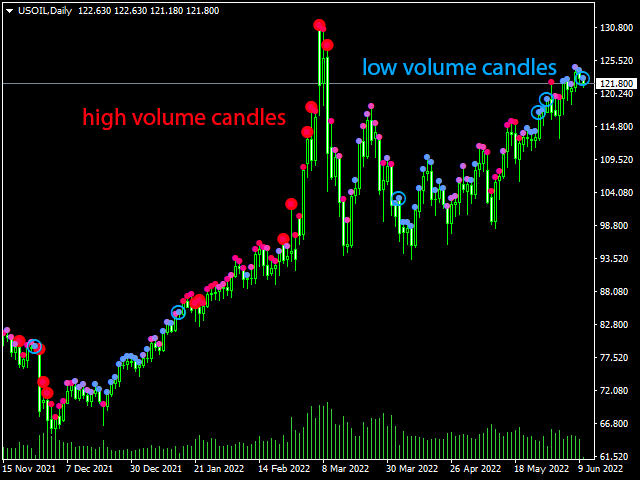
When applied to a chart, the Candle Volume Heatmap indicator applies colored dots to each bar which may vary according to its volume. The chart becomes a heatmap where you can easily spot which parts of the bar history are “hottest” or the bars that had the greatest number of volume and the “coldest” or ones that had the least volume. The indicator uses colors that transitions from BLUE to RED where shades closer to blue are “cold” (low volume) and those that are more in the shade of red are considered “hot” (high volume).
- Blue candlesticks – has low volume
- Red candlesticks – has high volume
High and Low Volume Bars
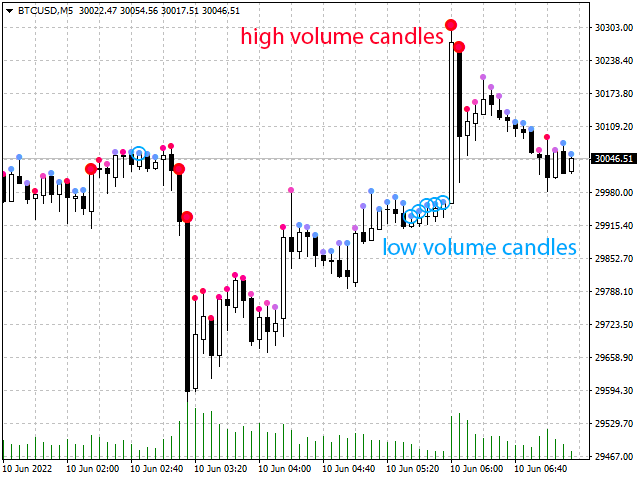
In addition to colored dots, the Candle Volume Heatmap indicator also marks candlesticks that have the lowest and highest volume within a certain length. Low and high-volume bars are marked as follows:
- Low volume candlesticks are marked with a hollow circle above them signifying a very low volume.
- High volume candlesticks are marked with a large solid circle above them signifying a very high volume. These candlesticks along with others that have red-colored dots are the ones that should be monitored most.
Uses
Identifying low and high-volume bars can be useful in determining whether there is weight or “force” behind the price action that occurs in each bar. High volume bars can be used to validate candlestick reversal patterns and confirm breakouts in support and resistance levels.
Alerts
Alerts are triggered when the Activate Alerts input is enabled in the indicator options. It monitors the following events:
High/Low Volume
- High volume – when the candlestick reaches the highest volume among the given Length of bars; alerts from this condition can be triggered by forming candlesticks that have the highest volume signal (a solid red circle)
- Low volume – when the candlestick reaches the lowest volume among the given Length of bars; alerts from this condition must be triggered by a confirmed/closed candlestick with the lowest volume signal (a hollow blue circle)
Inputs
- Length – sets the number of bars the indicator analyzes at each execution.
- Look Back – sets how far back in the bar history the indicator should calculate for signals
- Display Highest Lowest Only – if true, the indicator displays signals for the High volume and Low volume candlesticks only
- Display Under Candles – if true, the indicator displays the dots at the bottom of the candlesticks
- Activate Alerts – allows the indicator to send alert messages on certain events
- Activate Send Notifications – allows the indicator to send alert messages to the user’s mobile device if push notifications are configured in the MT4 terminal

