TIL Trend Navigator for MT4
- Indicators
- Viktor Macariola
- Version: 1.0
- Activations: 20
Trading Indicator Lab’s Trend Navigator for MT4 is an indicator that can help you reveal the underlying trends in any chart on any timeframe.
Determining Trends
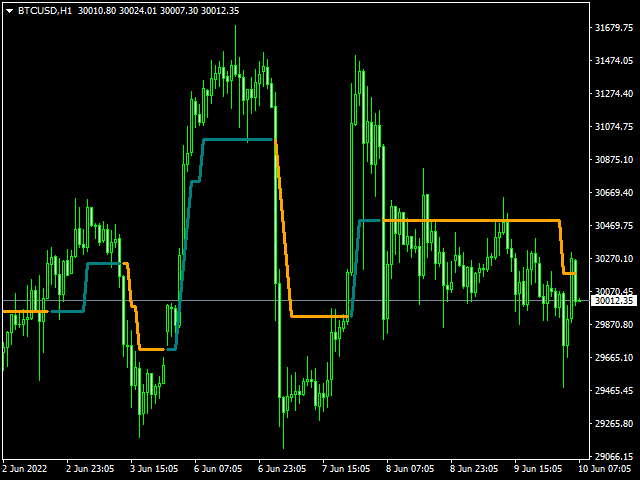
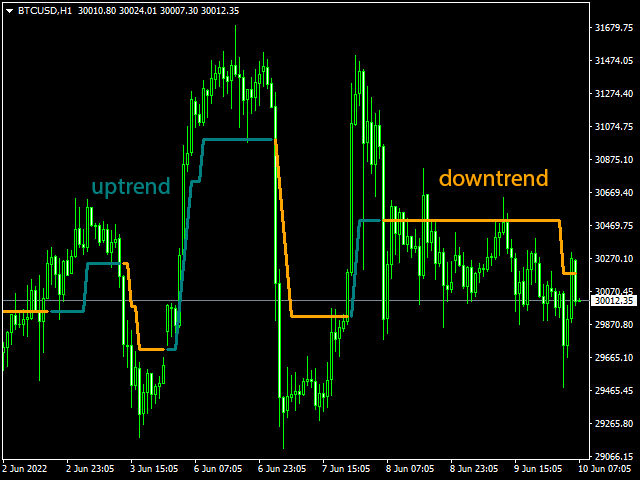
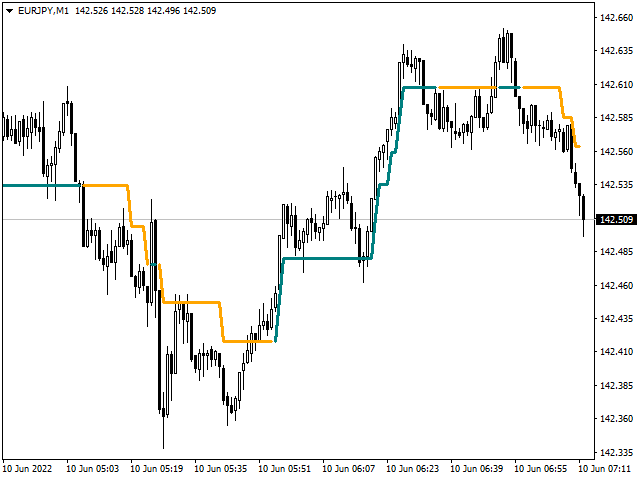
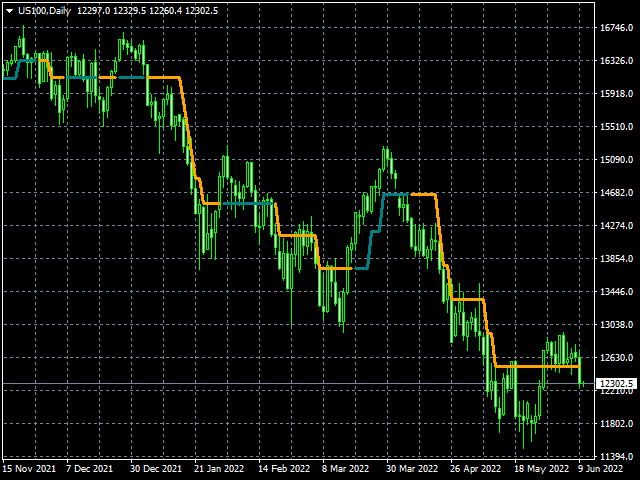
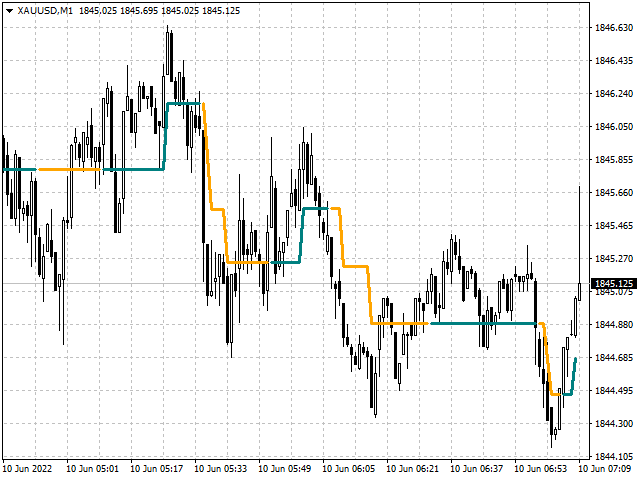
It only takes a minute or two to analyze the indicator with its simple yet insightful methods of representing bullish, bearish and ranging price action across the chart. It forms a single line that runs in 3 directions:
- Upward direction – represents a significant bullish price action
- Horizontal direction – represents ranging price action or consolidation
- Downward direction – represents a significant bearish price action
The indicator borrows the concept of Renko charts where upward and downward price action are shown to move at a single angle. This makes the indicator more intuitive and easier to read.
Support and Resistance
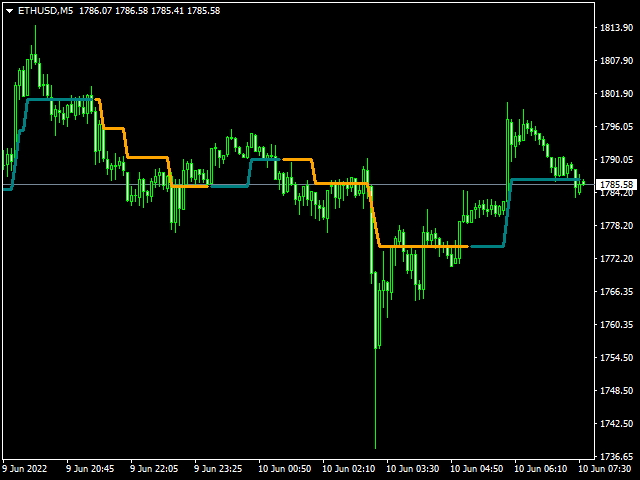
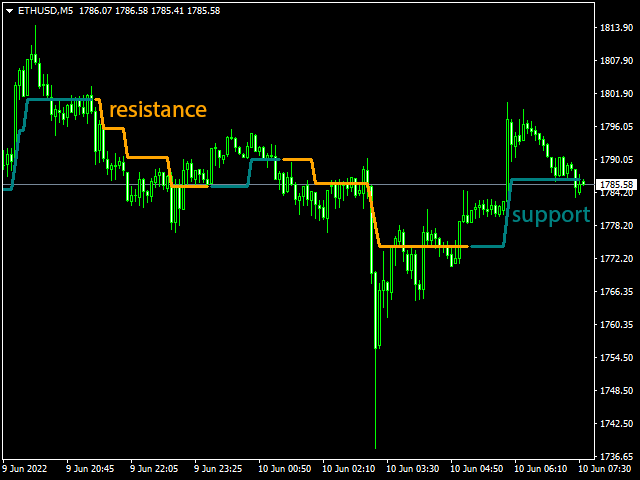
That’s not all. The Trend Navigator can also serve as a support or resistance line at any given point in the bar history. This is distinguished with the dual colors of the lines which alternates at each segment:
- Support segment (green) – the segment acts as support where price moves above the line
- Resistance segment (orange) – the segment acts as resistance where price moves below the line
Breakouts occur when the bar crosses above or below the Trend Navigator, at which point, its line changes color to signal the change of its role as a support or resistance level.
Alerts
Alerts are triggered when the Activate Alerts input is enabled in the indicator options. It monitors the following events:
Crossing Above/Crossing Below
- Crossing above – when price crosses above the indicator’s green or yellow line
- Crossing below – when price crosses below the indicator’s green or yellow line
Uptrending/Downtrending
- Uptrending – when the indicator determines the beginning of a bullish trend shown when the indicator line shifts color from orange to green (the color may vary if the default plot colors are modified)
- Downtrending – when the indicator determines the beginning of a bearish trend shown when the indicator line shifts color from green to orange (the color may vary if the default plot colors are modified)
The candlesticks that meet the criteria of the alert conditions must be confirmed (closed) first before prompting an alert message.
Inputs
- Length – sets the number of bars the indicator analyzes at each execution
- Support Segment Color – allows the user to change the color of the support segments. Its default color is green
- Resistance Segment Color – allows the user to change the color of the resistance segments. Its default color is orange
- Activate Alerts – allows the indicator to send alert messages on certain events
- Activate Send Notifications – allows the indicator to send alert messages to the user’s mobile device if push notifications are configured in the MT4 terminal

