Trend Entries Histogram
- Indicators
- Guillermo Pineda
- Version: 1.22
- Activations: 5
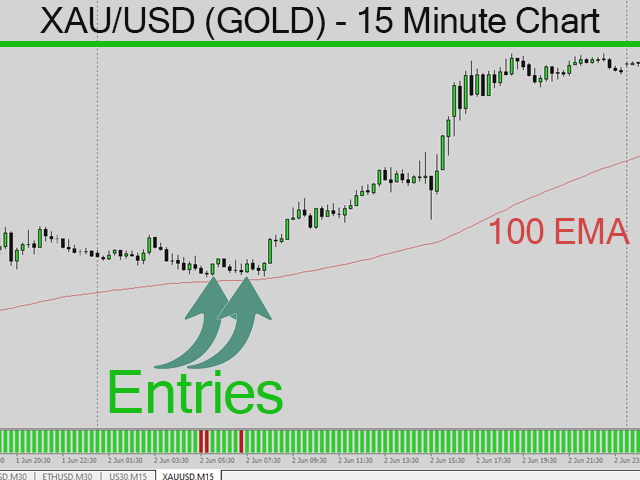
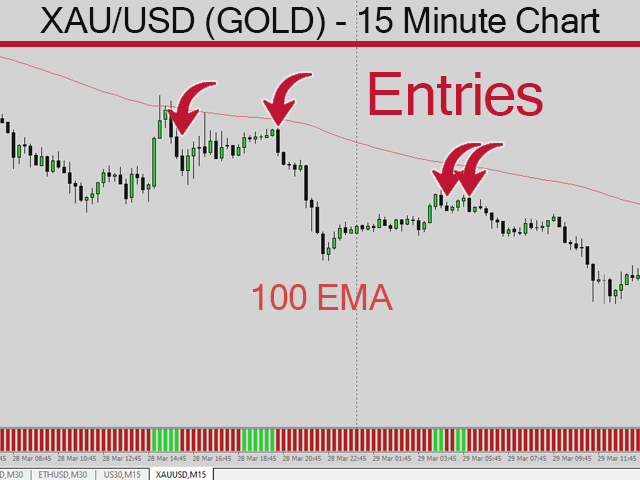
When a new high or low is made around a possible exhaustion point, the indicator detects breakouts and price momentum. The indicator draws a histogram when a new high probability trade setup depending on the current trend. Price weakens to the point that it closes above or below the rectangle, indicating a potential shift.
To see how the indicator works, check out the video below!
Features Notifies you of prospective market structure changes at crucial depletion times.
As the price reaches exhaustion levels, it automatically draws in short-term market structure.
All symbols and timeframes are supported.
Great for trend traders and determining trend direction and entries on larger time frames.
On a lower time frame chart, look for a directional bias arrow from a higher time signal.