True ATR
- Indicators
- Boris Tikhanovich
- Version: 1.0
- Activations: 5
Всем привет. Представляю Вашему вниманию Индикатор TRUE ATR.
Так же есть данный индикатор для mt4 https://www.mql5.com/ru/market/product/82414
Данный индикатор работает на всех рынках.
TRUE ATR высчитывает среднестатистическое движение инструмента за 1 день и показывает сколько в инструменте осталось энергии внутри дня.
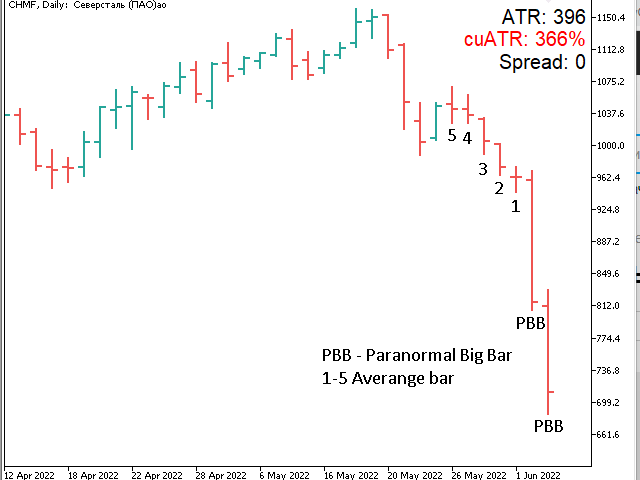
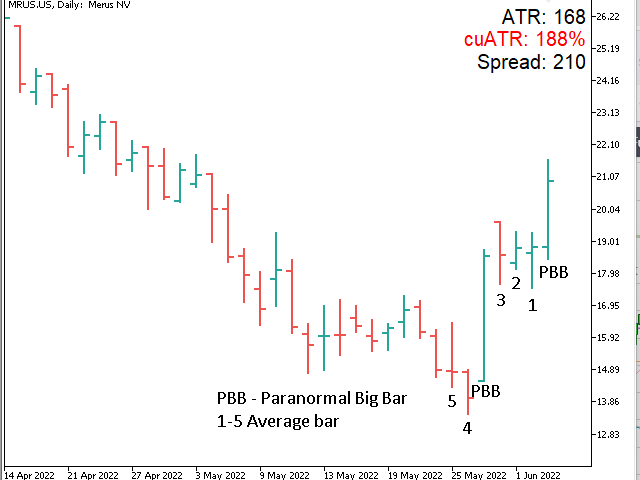
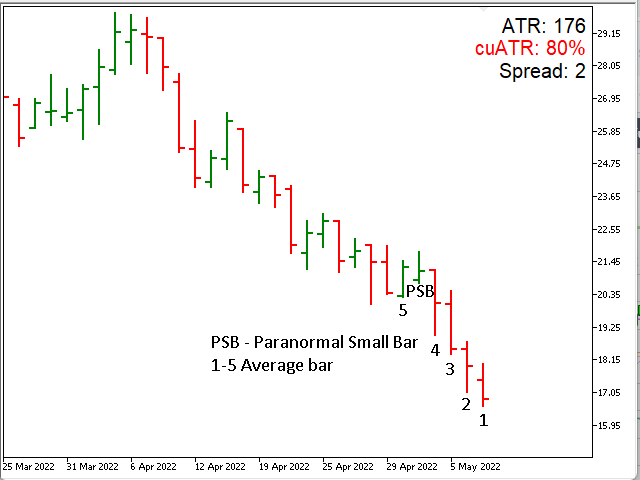
В отличие от классического индикатора АТР которые без разбора учитывает все бары(свечи), TRUE ATR при расчете среднестатистического движения инструмента использует ближайших 5 торговых дней без учета паранормальных больших и малых баров (свечей). Так же не учитываются ГИПЕР большие бары (свечи) от 3-х АТР.
Параметры:
- Paranormal big bar: 1.7 - Коэффициент Паранормально большого бара. Если бар больше среднестатистического на 1.7, то определяется как Паранормально большой бар и в расчет не берется.
- Paranormal small bar: 0.7 - Коэффициент Паранормально малого бара. Если бар меньше среднестатистического на 0.7, то определяется как Паранормально малый бар и в расчет не берется.
- Change color on red: 50% - Сменить цвет на красный при прохождении более 50 % внутри дня от среднестатистического движения инструмента.
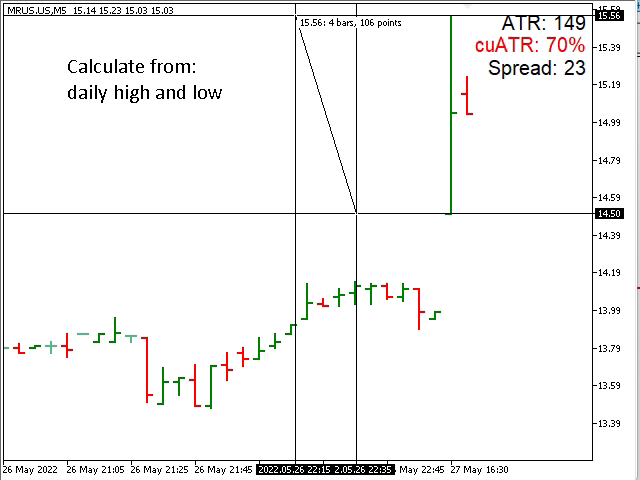
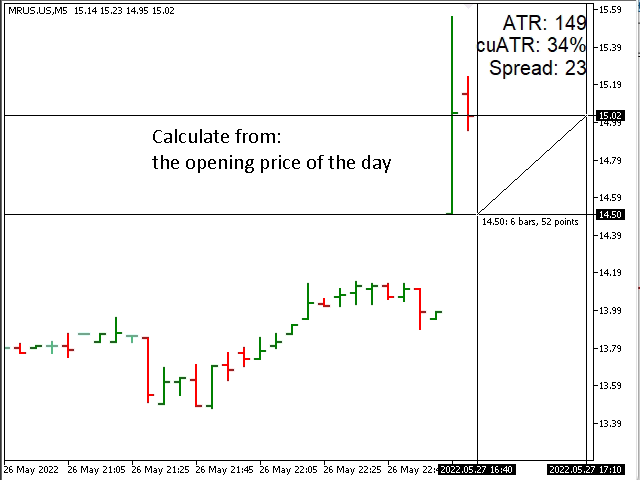
- Calculate_from:
daily high and low - Расчет внутридневной энергии происходит по текущему дневному Hi и Low.
the previous day's closing price - Точка отсчета ATR начинается от цены закрытия предыдущего дня. Если был ГЭП, то он тоже учитывается. Чем дальше от точки отсчета, тем больше процент потраченной внутридневной энергии и наоборот.
the opening price of the day - Точка отсчета ATR начинается от цены открытия текущего дня. Чем цена дальше от точки отсчета, тем больше процент потраченной внутридневной энергии и наоборот.
- Show spread: True - Показывать на графике текущий Спред.
- Text color: Black - Цвет текста на графике.
- Font size: 15 - Размер шрифта на графике.
- Text position: Расположение информации на графике
Upper left corner - Верхний левый угол
Lower left corner - Нижний левый угол
Upper right corner - Верхний правый угол
Lower right corner - Нижний правый угол
Показатели на графике:
- ATR - среднестатистический ATR за 5 торговых дней без учета паранормальных больших и малых баров (свечей).
- cuATR - процент потраченной внутридневной энергии.(Меняет цвет на красный если больше параметра Change color on red).
- Spread - Спред.