Price Average Mt5
- Indicators
- Kenneth Parling
- Version: 1.0
- Activations: 7
A common sense approach to price observation
- Buy when prices are going higher and sell when prices are going lower
The above statement of buying when prices are going higher or selling when prices are going lower may be too broad and therefore it may need some guidelines and rules, this is where The 3 Duck’s comes into play.
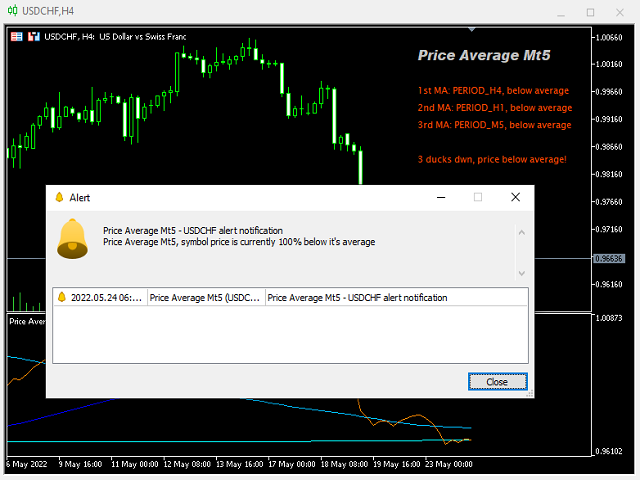
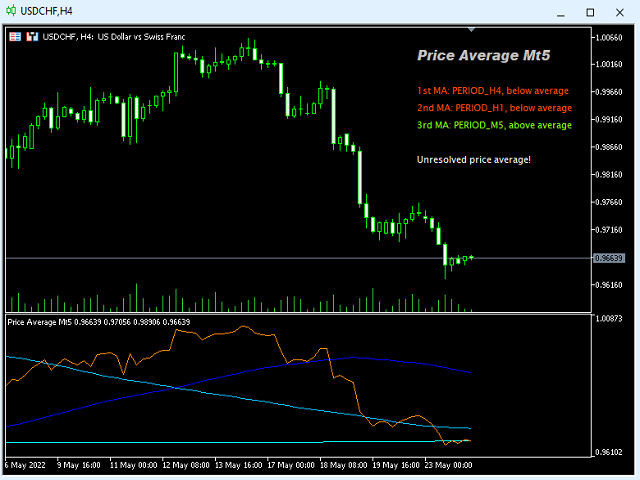
Price Average Mt5 indicator will help you identify buying opportunities in the direction of the last uptrend and selling opportunities in the direction of the last downtrend. The “duck's” in the title comes from the saying “to have all your ducks lined up” an expression meaning to have everything in the correct order. There are three ducks, the first duck will help you to identify the last up or down trend, the second duck helps to confirm the direction of the trend and the third duck will help to identify buying or selling opportunity in the direction of the trend.This indicator involves using three different timeframe, a 4 hour chart (first duck), a 1 hour chart (second duck) and a 5 minute chart (third duck).
- The first thing we need to do is look at our largest time-frame (4hour 1st duck) and see if current prices are above or below. This duck tells us that current price is above or below. This tells us that we maybe looking to buy or sell.
- The second thing we need to do is to look at our (1hour 2nd duck), we need to see the current price above or below on this chart also, this gives us confirmation, for example if these both ducks now below average we focus on selling and if they are above we focus on buying. Important - If the current price average does not match the 1st duck (4hr) we can not move on to step 3.
- From step 1 and 2, example for buying - current prices 1st, 2nd and 3rd duck now needs to be above it's average. Now on the 3rd duck (5 minute) we are looking for extra confirmation by opening up an additional 5 minute chart without this indicator and we should wait and let price break the last high on the 5 min chart to open a buy order.
What about targets?
- Stop loss
This is where you can make this system your own. If you are a short term trader you may want to put your stop-loss below the lows on the 5 min or the 1 hr chart. If you are more of a positional trader you may wish to put your stop-loss above a low on the 4 hr chart. You could also use a fixed stop-loss, maybe 25-30 pips or more from entry. It all depends what type of a trader you are, so you decide! If you are a longer term trader or investor, this system can help you get a good entry point into the market. Another "trick" that may help you preserve capital, if you do buy and prices get back below the 5 min 60 sma by 10 pips (not a good sign) you may want to cut your losses short before your stop-loss. But if you are a longer term trader this may not be a big deal for you.
- Take profit
Once again, this depends on what type of a trader you are but profit targets can be for example support or resistance levels or something else that suits your trading style.
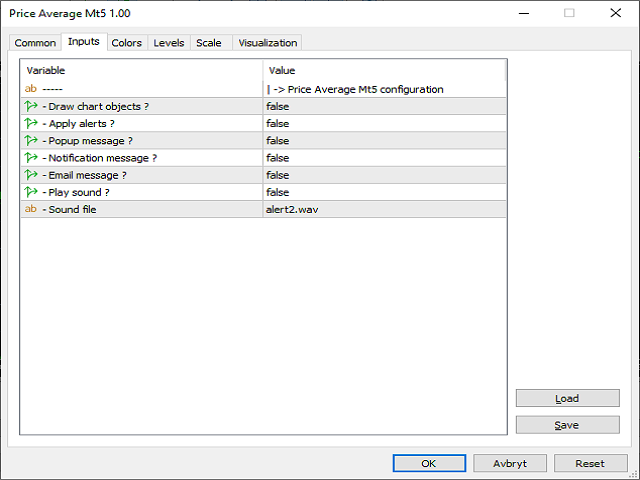
Indicator settings
- Show indicator panel - Show/hide signal panel
- Apply alerts - Allow alerts to be used
- Pop up - Pop up messages
- Notifications - Push notification messages ( requires that you have set up your terminal to work with this)
- Email - Email messages ( requires that you have set up your terminal to work with this)
- Sound - Play a sound

