MACD 2 Lines
- Indicators
- Markus Paminger
- Version: 1.70
- Activations: 5
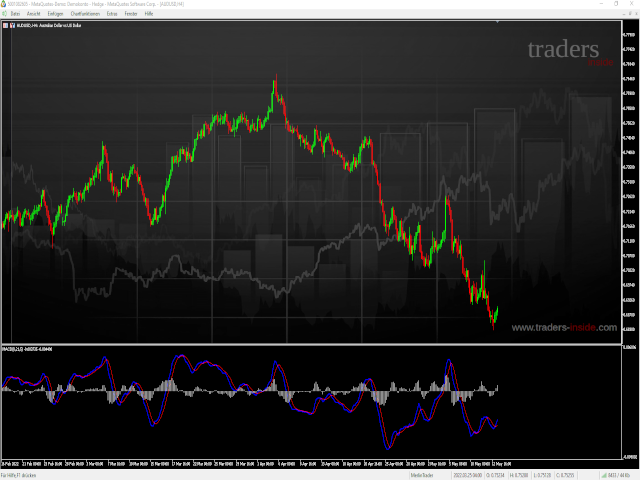
MACD with fast and slow EMA.
Moving average convergence divergence (MACD) is a trend-following momentum indicator that shows the relationship between two moving averages of a security's price.
The MACD is calculated by subtracting the fast-period exponential moving average (EMA) from the slow-period EMA.
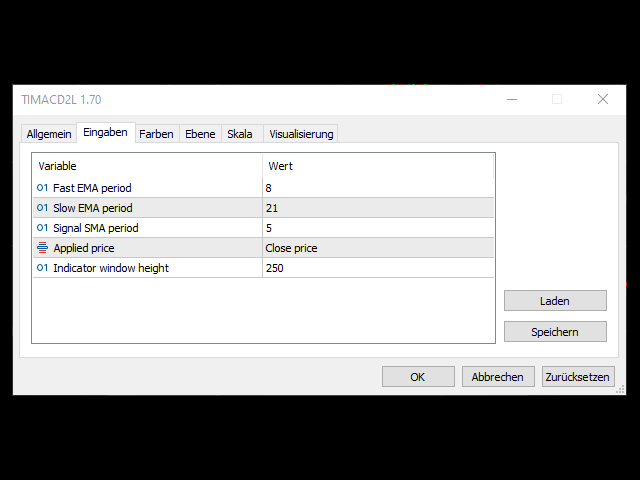
Setup options:
- Fast EMA period
- Slow EMA period
- Signal EMA period
- Applied price
- Indicator window height
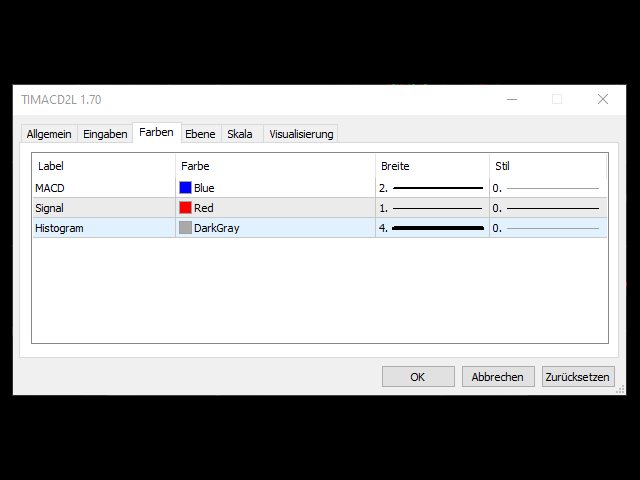
- Color MACD
- Color Signal
- Color Histogram


